OPERATOR’S MANUAL
WRXi-OM-E Rev C 139
where M
ref
= 0.316 V (that is, 0 dBm is defined as a sine wave of 0.316 V peak or 0.224 V rms, giving 1.0 mW
50 ohms).
into
The dBm Power Spectrum is the same as dBm Magnitude, as suggested in the above formula.
dBm Power Density:
wh e equivalent noise bandwidth of t ected window, and Delta f is
the current frequen
The FFT Power Ave
mput
M
n
2
= R'
n
2
+ I'
n
2
,
nd
se
FFT Glossary
defines uently used in FFT spectrum analysis and relates them to the oscilloscope.
e inpu
yquist fre ), there will be less than two samples per signal period.
ble from that of
e timebase and transform size should be selected so that the resulting Nyquist frequency is higher than the
highest significant component in the time
Coherent Ga alized cohe rre ch win ction
rectangula ss than 1.0 for n y due
w functio ss is compensate e following table lists
he implemented win .
ere ENBW is th he filter corresponding to the sel
cy resolution (bin width).
rage takes the complex frequency-domain data R'
n
and I'
n
for each spectrum generated in
es the square of the magnitude: Step 5, and co
then sums M
n
2 a
converted to the
counts the accumulated spectra. The total is normalized by the number of spectra and
lected result type using the same formulas as are used for the Fourier Transform.
This section the terms freq
Aliasing If th
than the N
t signal to a sampling acquisition system contains components whose frequency is greater
quency (half the sampling frequency
The result is that the
components below
contribution of these components to the sampled waveform is indistinguisha
the Nyquist frequency. This is aliasing.
Th
-domain record.
in The norm
r window and le
rent gain of a filter co
other windows. It defines the loss of sig
sponding to ea dow fun
al energ
is 1.0 (0 dB) for a
to the
multiplication by the windo
the values for t
n. This lo
dows
d for in the oscilloscope. Th
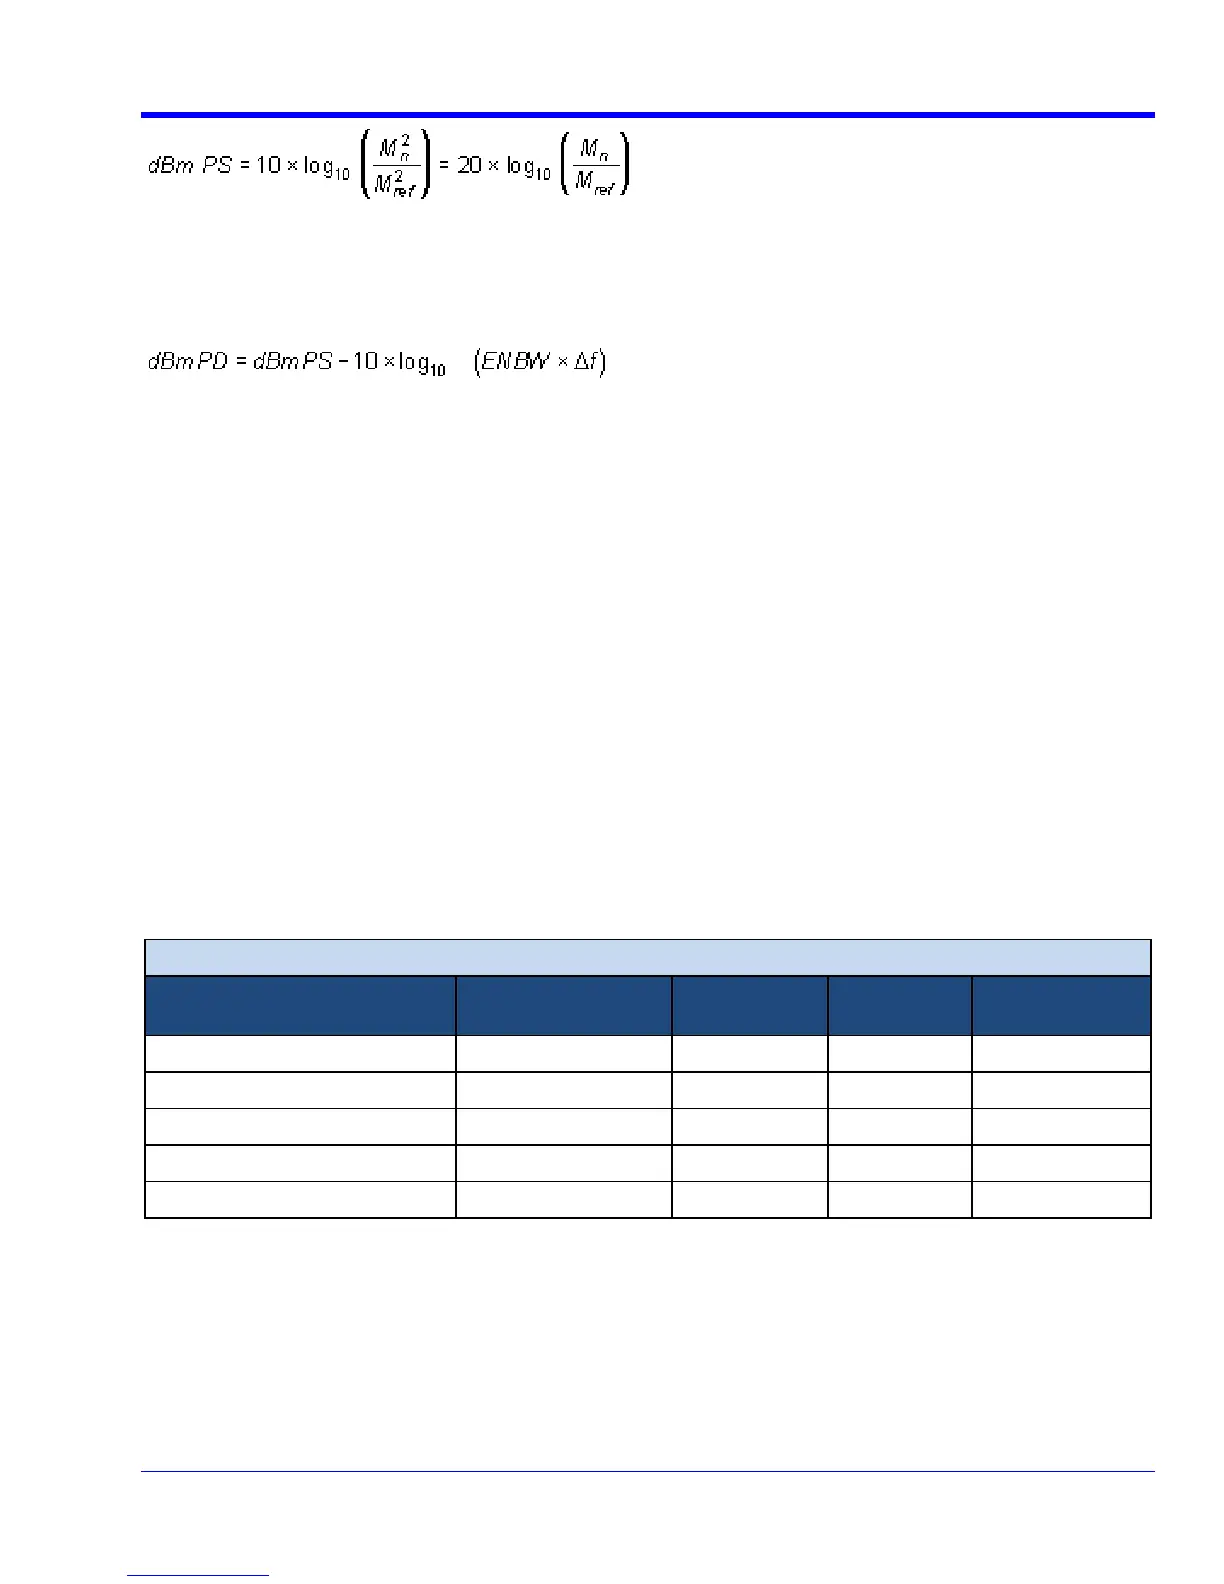
Window Frequency Do Parametermain s
Window Type
Highest Side Lobe
(dB)
Scallop Loss
(dB)
ENBW
(bins)
Coherent Gain
(dB)
Rectangular
-13 3.92 1.0 0.0
-32 1.42 1.5 -6.02
von Hann
Hamming
-43 1.78 1.37 -5.35
Flat Top
-44 0.01 2.96 -11.05
Blackman-Harris
-67 1.13 1.71 -7.53
ENBW Equivalent Noise BandWidth (ENBW) is the bandwidth of a rectangular filter (same gain at the center
a
N-point FFT is equivalent to passing the time-domain input signal through N/2 filters and
s N
as harmonic components of the input signal.
frequency), equivalent to a filter associated with each frequency bin, which would collect the same power from
white noise signal. In the table on the previous page, the ENBW is listed for each window function implemented,
given in bins.
Filters Computing an
plotting their outputs against the frequency. The spacing of filters is Delta f = 1/T, while the bandwidth depends on
the window function used (see Frequency Bins).
Frequency Bins The FFT algorithm takes a discrete source waveform, defined over N points, and compute
complex Fourier coefficients, which are interpreted

 Loading...