WAVERUNNER XI SERIES
Histogram parameters are provided to enable these measurements. Available through selecting Statistics from
the Category menu, they are calculated for the selected section between the parameter cursors:
98 WRXi-OM-E Rev C
dth (of largest peak) at half the maximum bin
pl - histogram amplitude between two largest peaks
st of two largest peaks
bin in a histogram
ram that divides the population into two equal halves
ft-most) populated bin in a histogram
histogram top or rightmost of two largest peaks
on of most populated bin in histogram
populated bin in histogram
histogram for which specified `x'% of population is smaller
s position of specified largest peak
• fwhm - full wi
• fwxx - full width (of largest peak) at xx% the maximum bin
• hist am
• hist base - histogram base or leftmo
• hist max - value of the highest (right-most) populated
• hist mean - average or mean value of data in the histogram
• hist median - value of the x-axis of a histog
• hist min - value of the lowest (le
• hist rms - rms value of data in histogram
• hist sdev - standard deviation of values in a histogram
• hist top -
• max populate - populati
• mode - data value of most
• percentile - data value in
• peaks - number of peaks in histogram
• pop @ x - population of bin for specified horizontal coordinate
• range - difference between highest and lowest data values
• total pop - total population in histogram
• x at peak - x-axi
Histogram Peaks
Because the shape of histogram distributions is particularly interesting, additional parameter measurements are
available for analyzing these distributions. They are generally centered on one of several peak value bins, known,
with its associated bins, as a histogram peak.
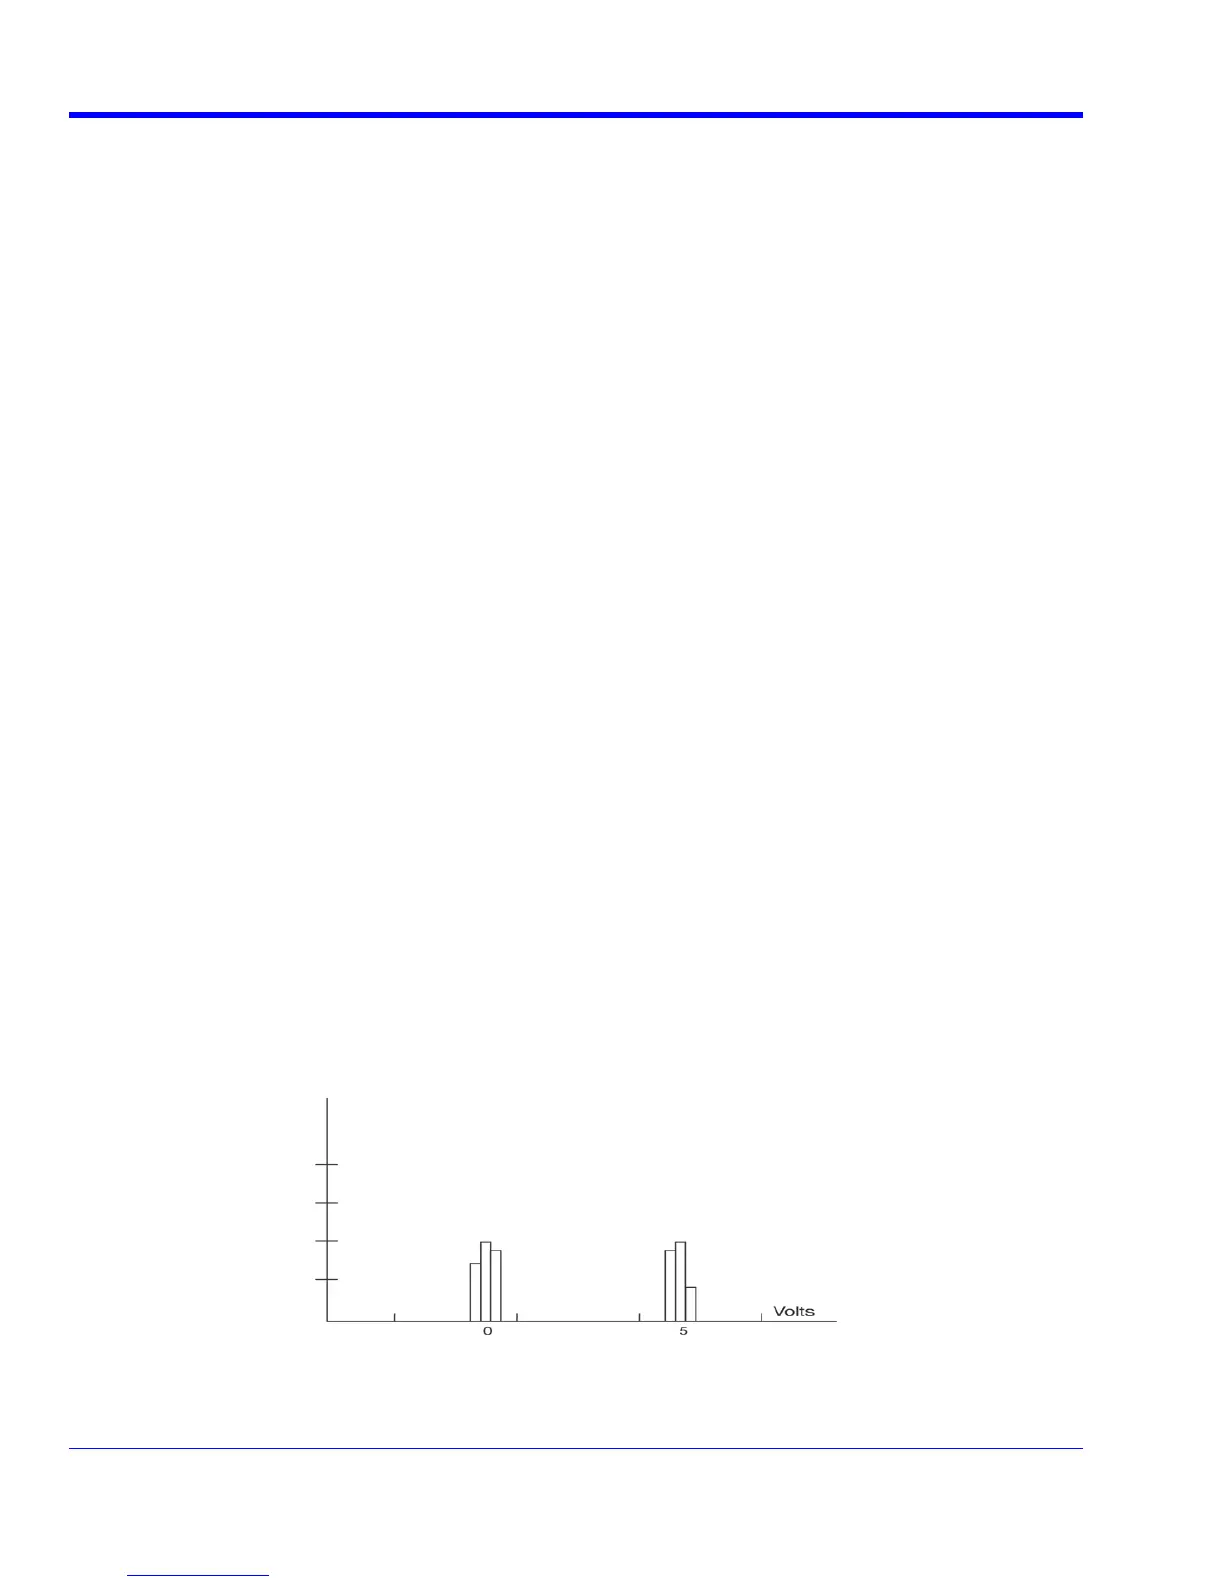
Example: In the following figure, a histogram of the voltage value of a five-volt amplitude square wave is centered
around two peak value bins: 0 V and 5 V. The adjacent bins signify variation due to noise. The graph of the
centered bins shows both as peaks.
Determining such peaks is very useful because they indicate dominant values of a signal.

 Loading...