WAVERUNNER XI SERIES
9. In the dialog to the right, touch the Histogram tab.
10. Under "Buffer," touch inside the #Values field and enter a value.
88 WRXi-OM-E Rev C
11. Under "Scaling," touch inside the #Bins field and enter a value from 20 to 2000.
d h,
1. In the menu bar, touch Math, then Math Setup.
h Fx The num
ded on your oscilloscope. See specifications..
Graph button
12. Touch the Find Center an Width button to center the histogram. Or touch inside the Center, then the Widt
fields and enter a value using the pop-up numeric keypad.
F
ROM MATH DIALOG
2. Touch one of function tabs F1 throug ber of math traces available depends on the software
options loa
3. Touch the .
4. Touch inside the Source1 field and select a source from the pop-up menu.
5. Touch inside the Measurement field and select a parameter from the pop-up menu.
6. Touch inside the Graph with field and select Histogram from the pop-up menu.
7. In the dialog to the right, touch the Histogram tab.
8. Under "Buffer," touch inside the #Values field and enter a value from 20 to 1000.
9. Under "Scaling," touch inside the #Bins field and enter a value from 20 to 2000.
10. Touch the Find Center and Width button to center the histogram. Or touch inside the Center, then the
Width, fields and enter a value using the pop-up numeric keypad.
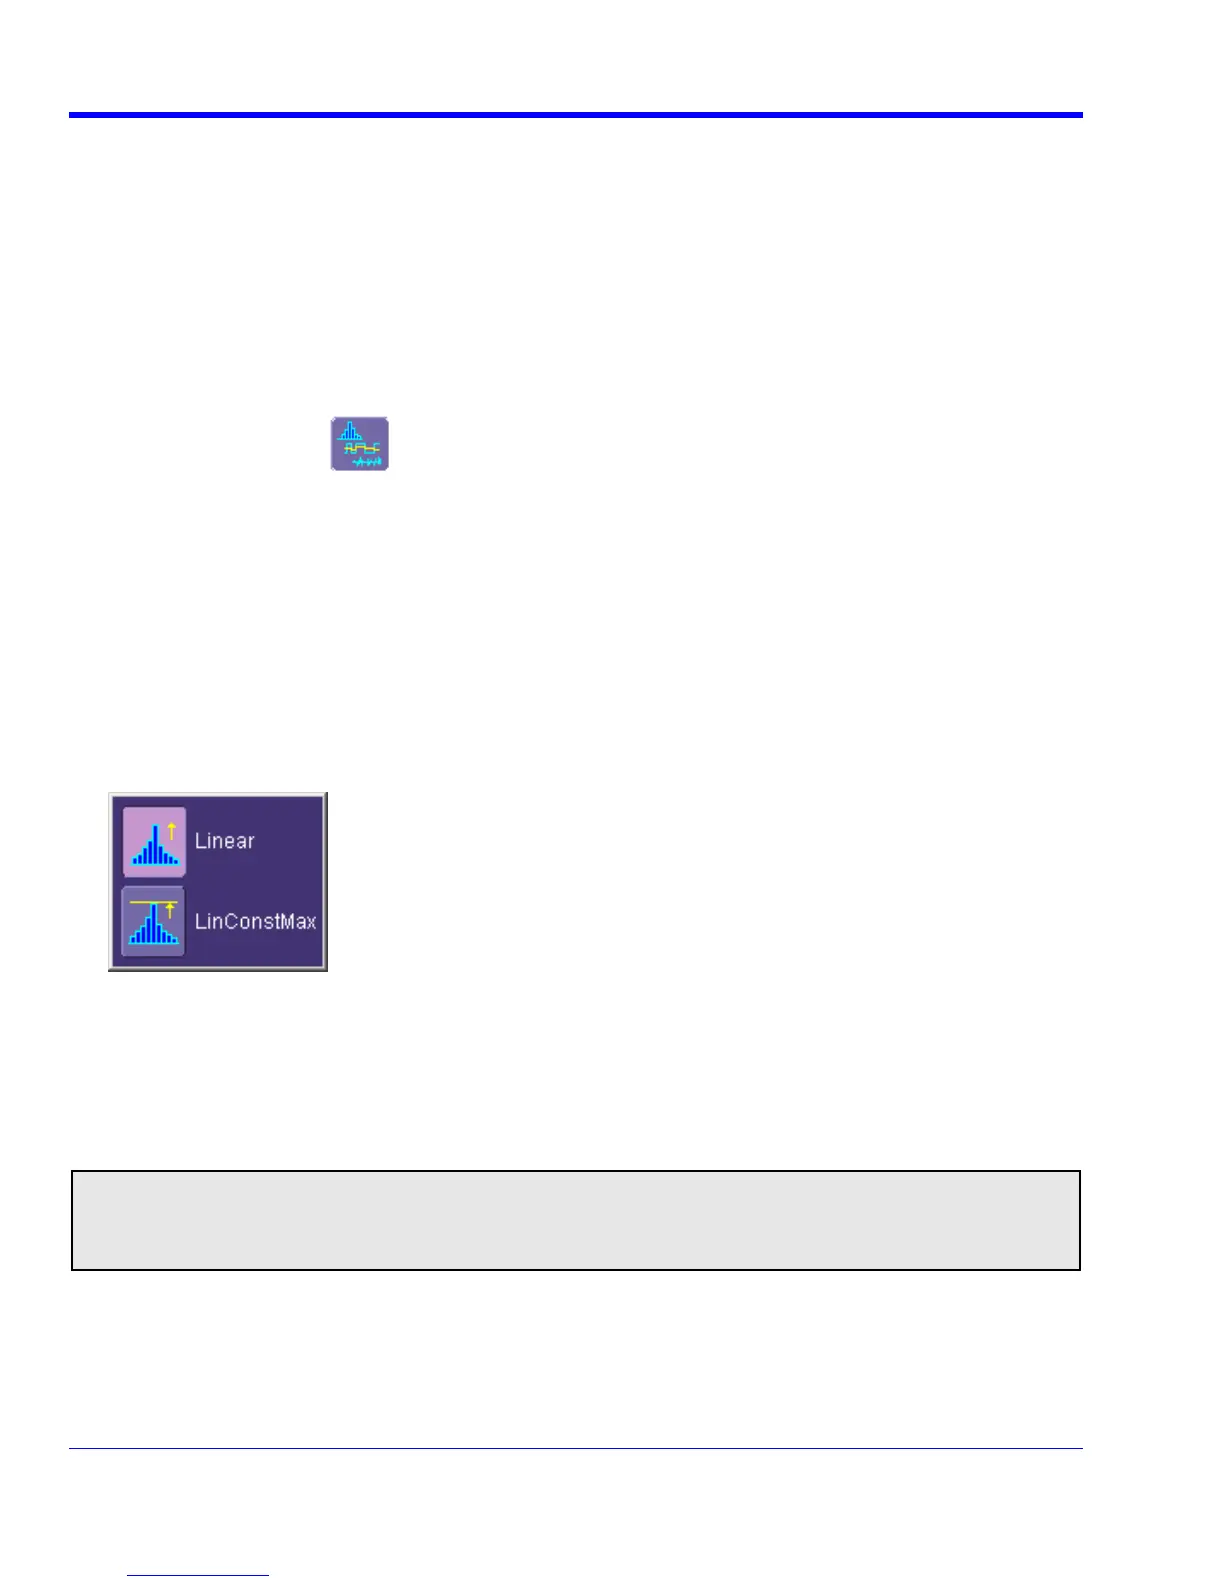
11. Touch inside the Vertical Scale field and select Linear or Linear Constant Max from the pop-up menu:
.
Viewing Thumbnail Histograms
Histicons are miniature histograms of parameter measurements that appear below the grid. These thumbnail
histograms let you see at a glance the statistical distribution of each parameter.
In the menu bar, touch Measure, then one of the Measure Mode buttons: Std Vertical, Std Horizontal, or My
y thumbnail histograms below the selected parameters.
Measure.
ch the Histicons chTou eckbox to displa
Note: For measurements set up in My Measure, you can quickly display an enlarged histogram of a thumbnail
histogram by touching the Histicon you want to enlarge. The enlarged histogram will appear superimposed on
the trace it describes. This does not apply to "Std Vertical" or "Std Horizontal" measurements.
Persistence Histogram
You can create a histogram of a persistence display also by cutting a horizontal or vertical slice through the
ent on the waveform.
ration and is not affected by Center and Width
waveform. You also decide the width of the slice and its horizontal or vertical placem
This math operation is different than the "Histogram" math ope
settings made there.

 Loading...