WAVERUNNER XI SERIES
168 WRXi-OM-E Rev C
l result on the instrument display, and use all of the instrument's tools to understand the
n on a result with a MATLAB function applied to it.
reached from a set of instrument
rived from those data, given the
re are some examples of what can be done with a
g a new waveform by manipulating the data of one or two input waveforms
• Creating a new waveform without using any of the input data
• Creating a new parameter by manipulating the data of one or two input waveforms
• Ch ging a vertical scale or a horizontal scale from linear to non-linear
nput waveforms.
E
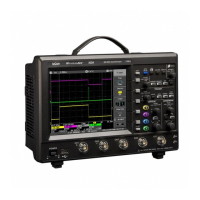
XAMPLE 1: SIMPLE MATH FUNCTIONS USING VBSCRIPT
• You can view the fina
result.
• You can do additional processing on the result by applying either standard instrument parameters, functions,
etc. to the returned result, or even more powerfully, adding chained customized functions. For example, you
can do an Excel calculatio
Solutions
Engineers do not buy equipment; they buy solutions. But what solutions can be
waveform data? The answer is, in principle, anything that can be logically de
limitations of signal-to-noise ratio and processing time. He
customized instrument:
• Changing the units of a grid to joules, newtons, amps, etc.
• Creatin
an
You don’t have to use all the data from the input waveforms: you can select data from one or more segments,
which need not be aligned in the two-i
Examples
WaveOut is the waveform being returned to the instrument (F1 in this case). WaveIn is the input waveform (C1 in
this case) You can see that the F1 result is displayed on the oscilloscope, and can be processed further.
VBS
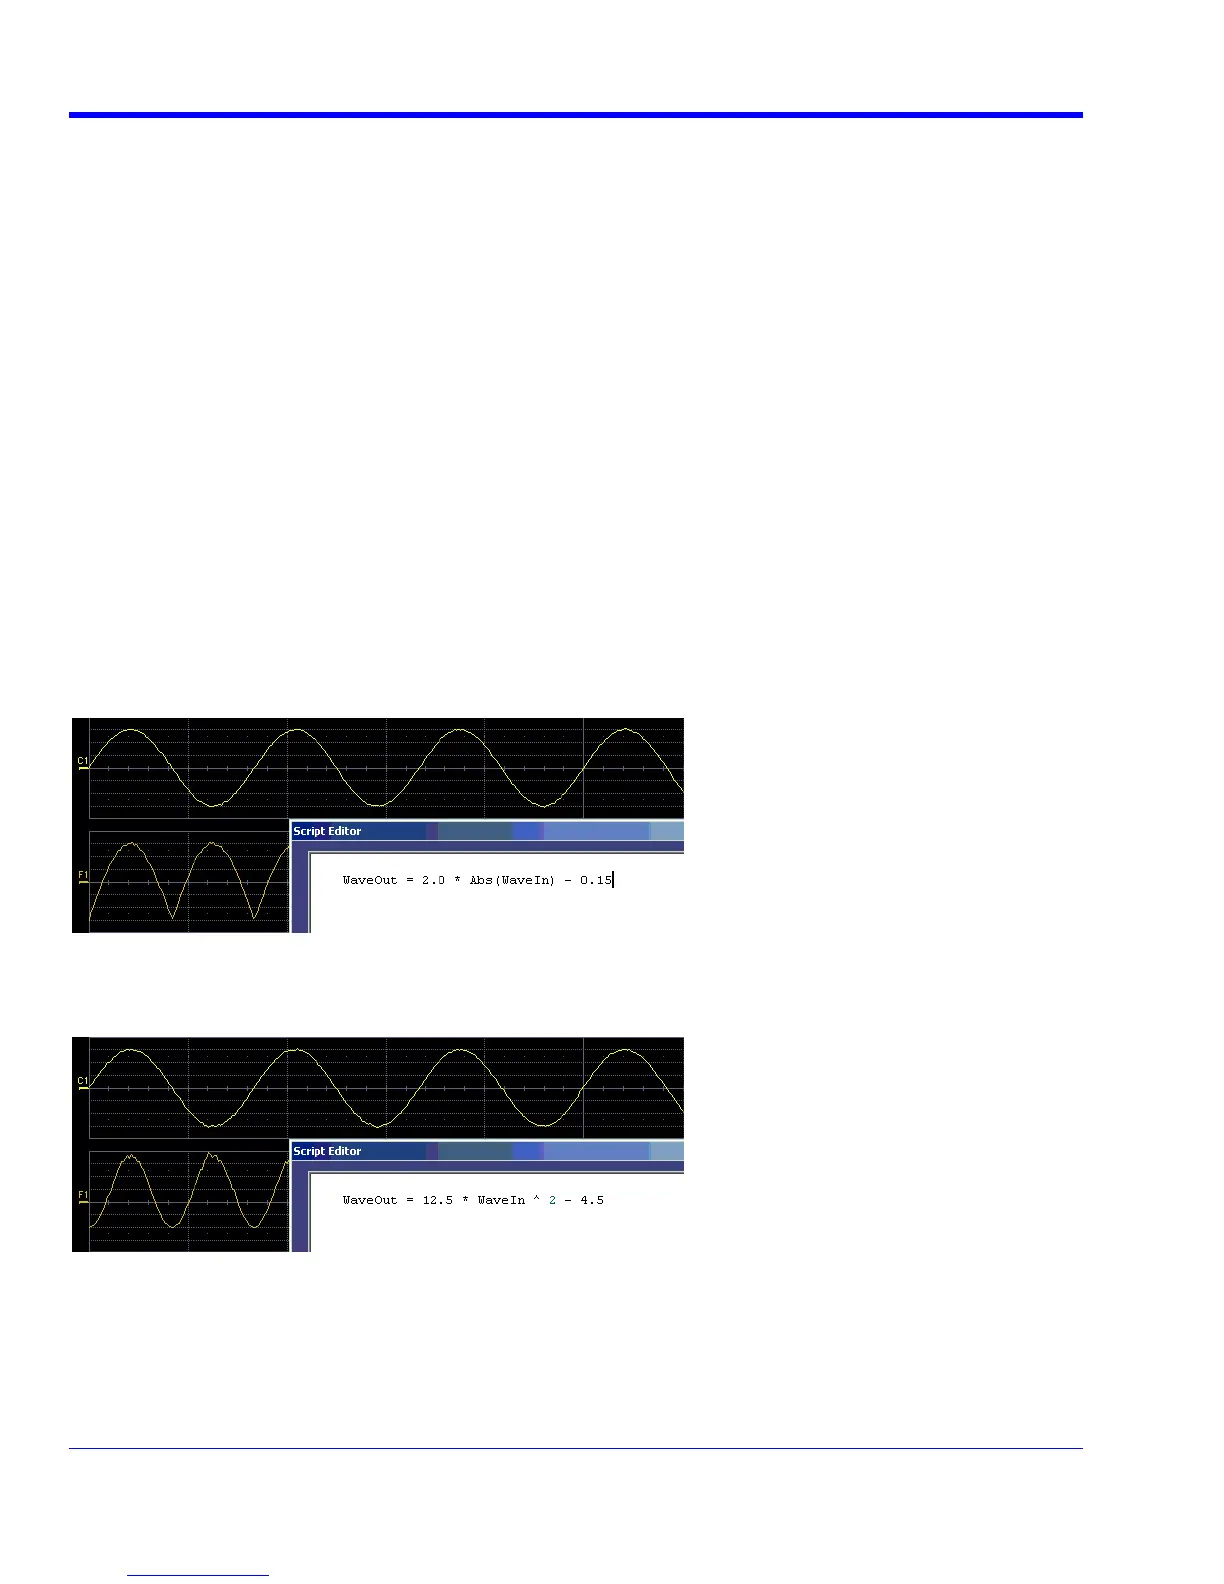
CEXAMPLE 2: ANOTHER SIMPLE MATH FUNCTION USING RIPT
Example 3 below doesn’t use the input data at all. The middle waveform (F2) is a "golden waveform", in this case
a perfect sine (subject to 16-bit resolution), that was created using a VBScript. The lower trace (F3) is a
subtraction of the acquired waveform (upper trace) and the golden waveform. The subtraction (of course)
contains all the noise, but it also shows the presence of a very small square wave signal.

 Loading...