Chapter 4: The chart application 51
4.10 Chart presentation
The chart has a number of content layers and display modes provid-
ing different kinds of display and information.
Chart layers
You can overlay data onto a chart window to give greater depth of
information. The overlays available are:
• AIS Objects
• Range Rings
• 3D locator
• Heading vector
• COG vector
• Tide and wind arrows
To switch layers on or off
1. Press the PRESENTATION softkey.
2. Press CHART LAYERS AND DATA softkey.
3. Press CHART LAYERS.
4. Use the TRACKPAD to select the appropriate layer and turn it on
or off as required.
5. Press OK to save your settings.
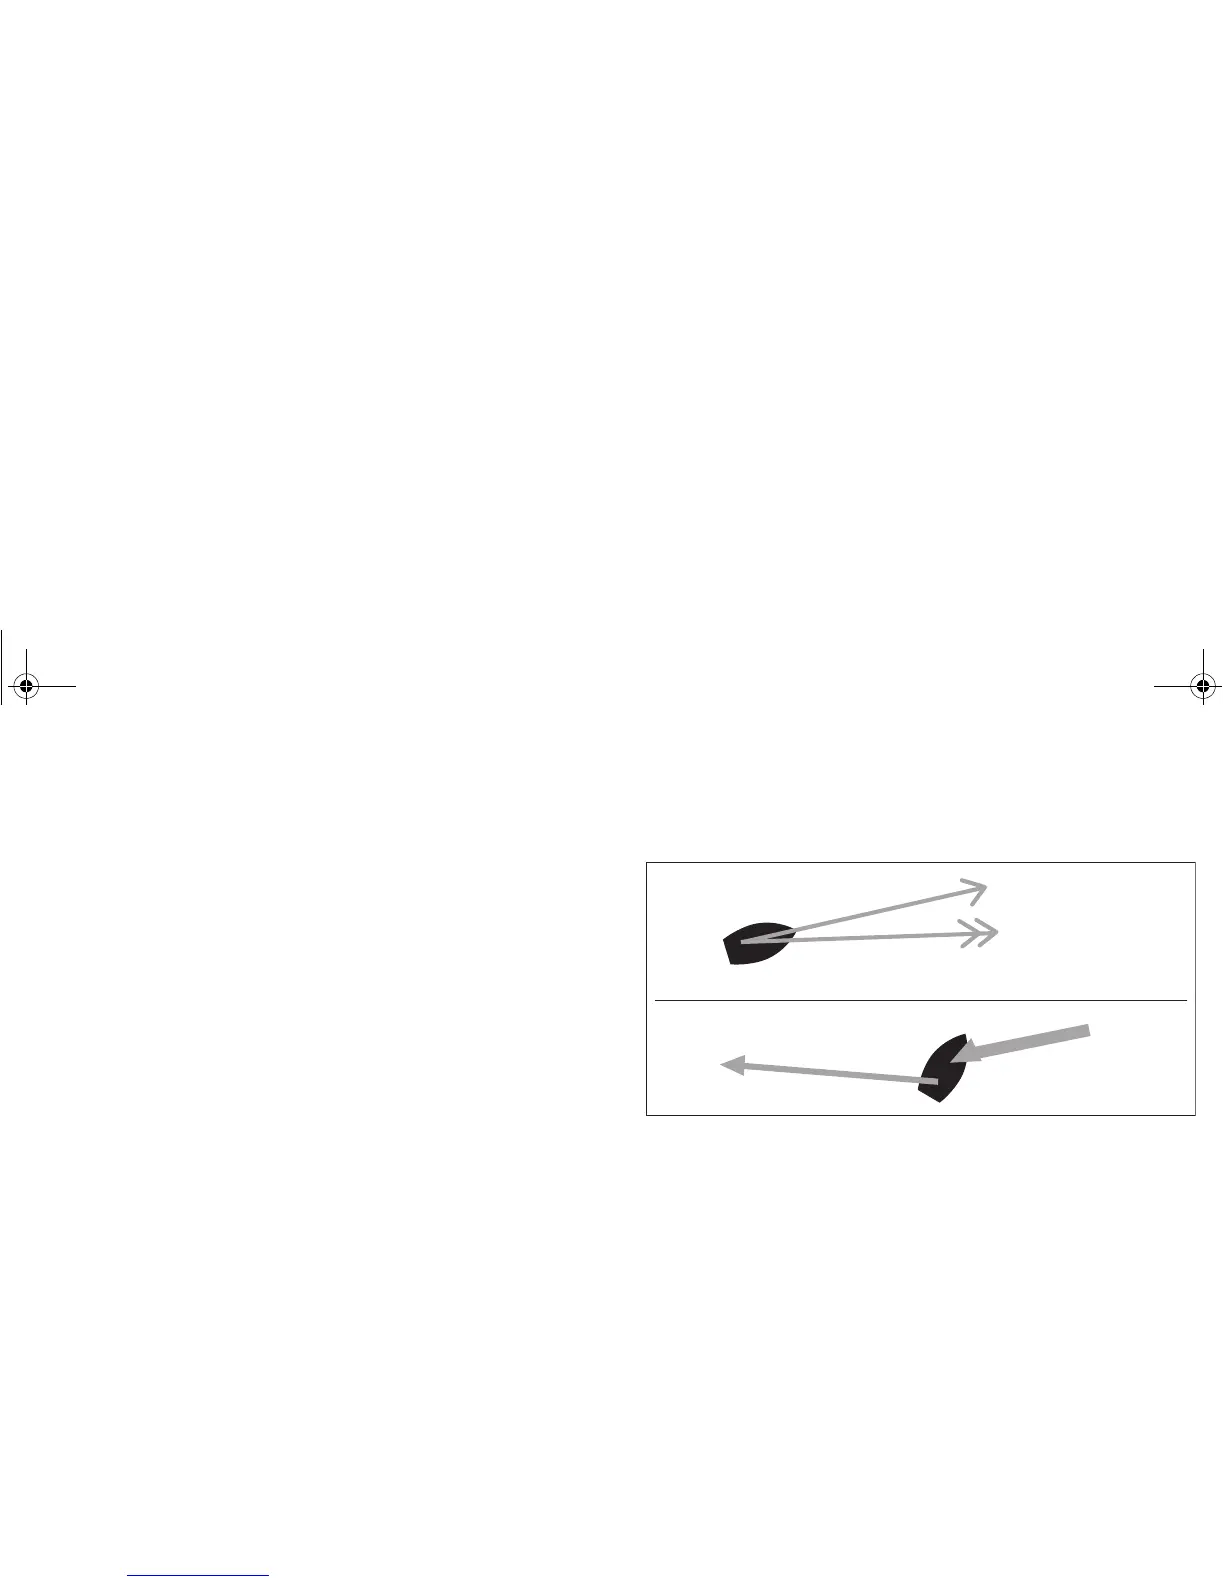
Vectors and arrows
The vectors and arrows are a chart presentation layer. They present
system data with relation to your vessel on the chart. This can assist
in monitoring your boat’s course.
Note: The vectors require appropriate data (e.g. wind data from a
wind instrument, SOG & COG calculated from the GPS fix).
To switch vectors on or off
1. Press the PRESENTATION softkey.
2. Press CHART LAYERS AND DATA softkey.
3. Press CHART LAYERS.
4. Use the TRACKPAD to select the appropriate layer and turn it on
or off as required.
5. Press OK to save your settings.
Heading vector
(HDG)
Course over ground
(COG)
Tide arrow
Wind arrow
81314-1_A Series Reference Guide.book Page 51 Thursday, August 28, 2008 9:23 AM
 Loading...