Start, stop, and step voltages
Most C-V data is derived from the sweep transition, or depletion region of the C-V curve. For that
reason, start and stop voltages should be chosen so that the depletion region makes up about 1/3 to
2/3 of the voltage range.
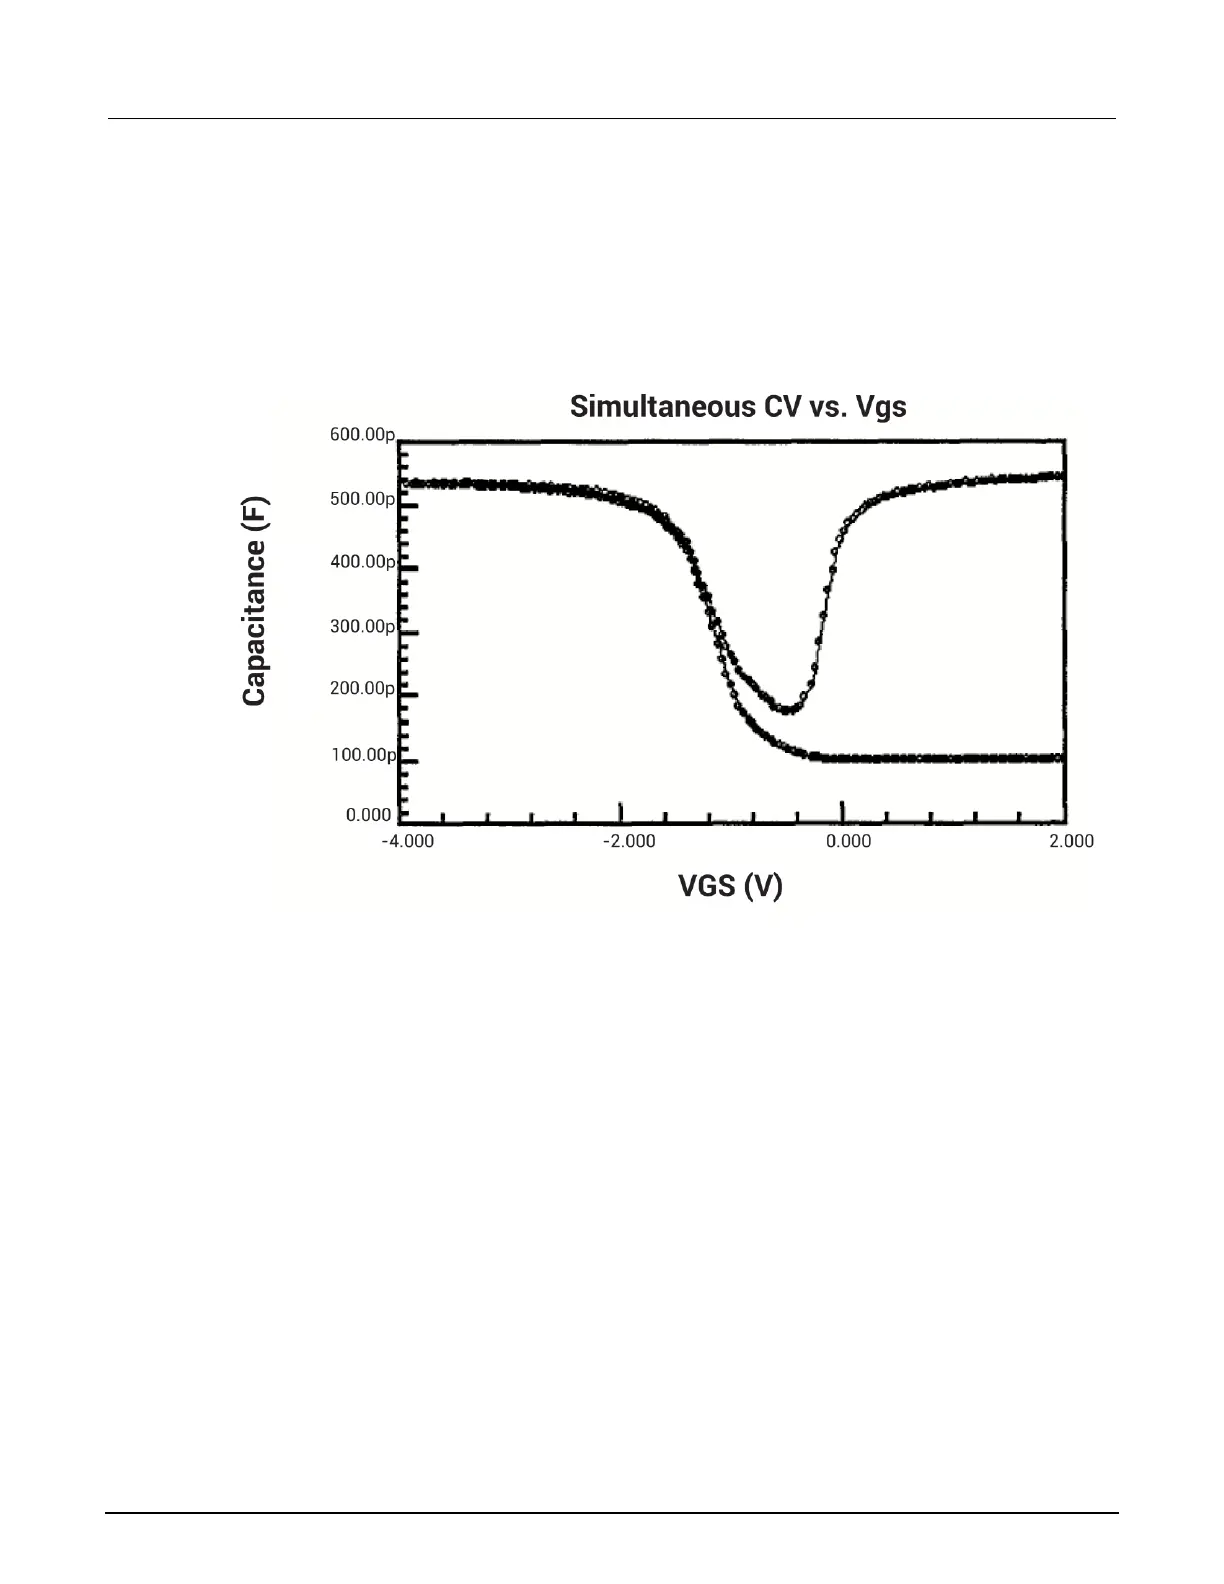
Figure 100: Typical simultaneous C-V curve
The upper flat, or accumulation region of the high frequency C-V curve defines the oxide capacitance,
COX. Since most analysis relies on the ratio C/COX, it is important that you choose a start or stop
voltage (depending on the sweep direction) to bias the device into strong accumulation at the start or
the end of the sweep.
You should carefully consider the size of the step voltage. Start, stop, and step size determine the
total number of points in the sweep. Some compromise is necessary between having too few points in
one situation, or too many points in the other.
For example, the complete doping profile is derived from data taken in the depletion region of the
curve by using a derivative calculation. As the point spacing decreases, the vertical point spacing is
increasingly caused by noise rather than changes in the signal. Consequently, choosing too many
points in the sweep results in increased noise rather than an increased resolution in C-V
measurement. It also takes more time to perform a C-V sweep.
Many calculations depend on good measurements in the depletion region, and too few points in this
region give poor results. A good compromise results from choosing parameters that yield a
capacitance change per step of approximately ten times the error in the signal.
 Loading...