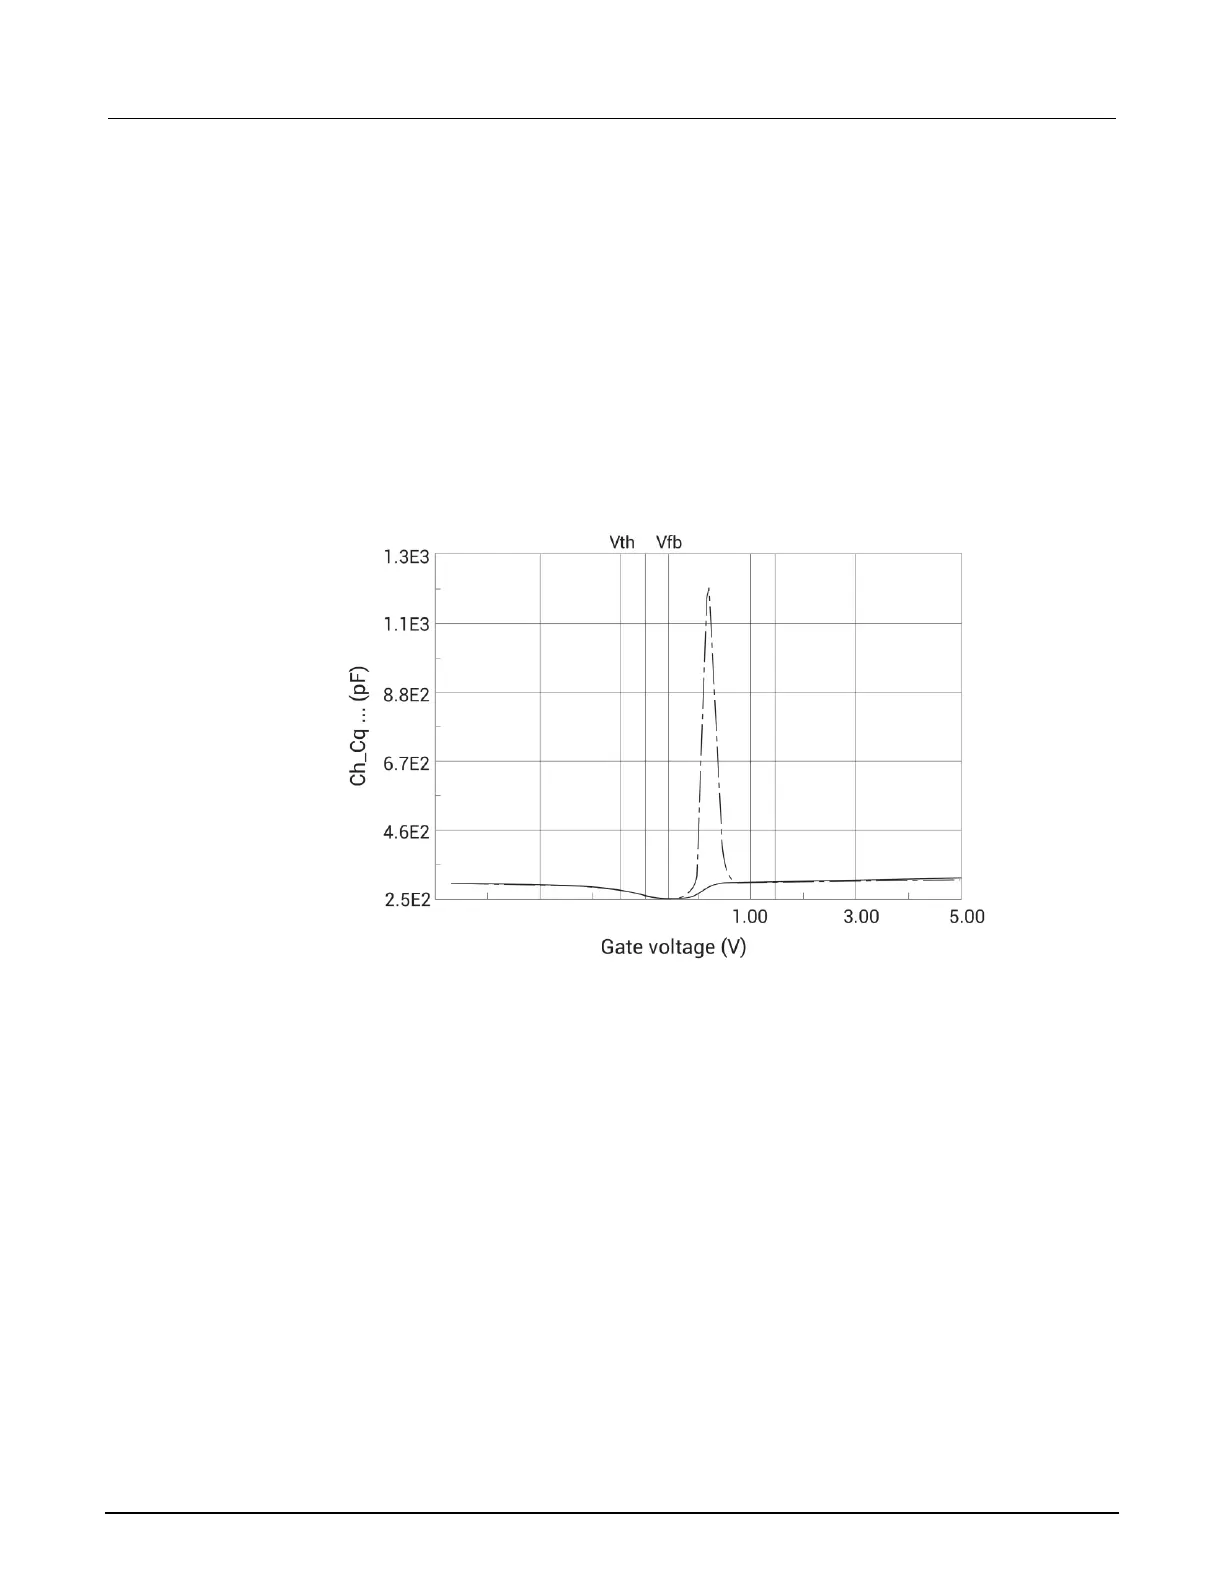
The following figure demonstrates what a contaminated oxide should produce for a STVS curve.
This method has four advantages over the BTS method:
1. It determines the mobile charges without interference from the interface trap charges.
2. It can determine the type of ion (sodium or potassium) that is contaminating the oxide, because
the peak in gate current for different ions occurs at different gate biases.
3. It provides measurements an order of magnitude more sensitive than bias temperature
stress BTS.
4. It is faster than the BTS method, since the device only needs heating once and the calculation
needs only one curve.
Figure 113: Simultaneous TVS plot on a highly contaminated wafer
Calculation of the mobile charge concentration could come from the measured V
GS
, C
q
, and C
h
data.
Alternatively, one can calculate the concentration graphically from the displayed simultaneous C-V
curves.
Generation velocity and generation lifetime (Zerbst plot)
Zerbst analysis requires two types of data: C-V and C-t. Important data taken from the C-V
measurement includes C
OX
, C
MIN
, and doping concentration (N
AVG
and N
BULK
). The results of the C-V
analysis are integrated with data taken during a C-t measurement to compute generation velocity and
generation lifetime of electron-hole pairs. These two parameters are computed from the slope and
y-axis intercept of the graph of G/nI vs. w-w
F
as outlined in the following computation information.
 Loading...