Printouts from ACTA ACTA 4000 User Guide
114 (136) 2008-12 9836 4171 01
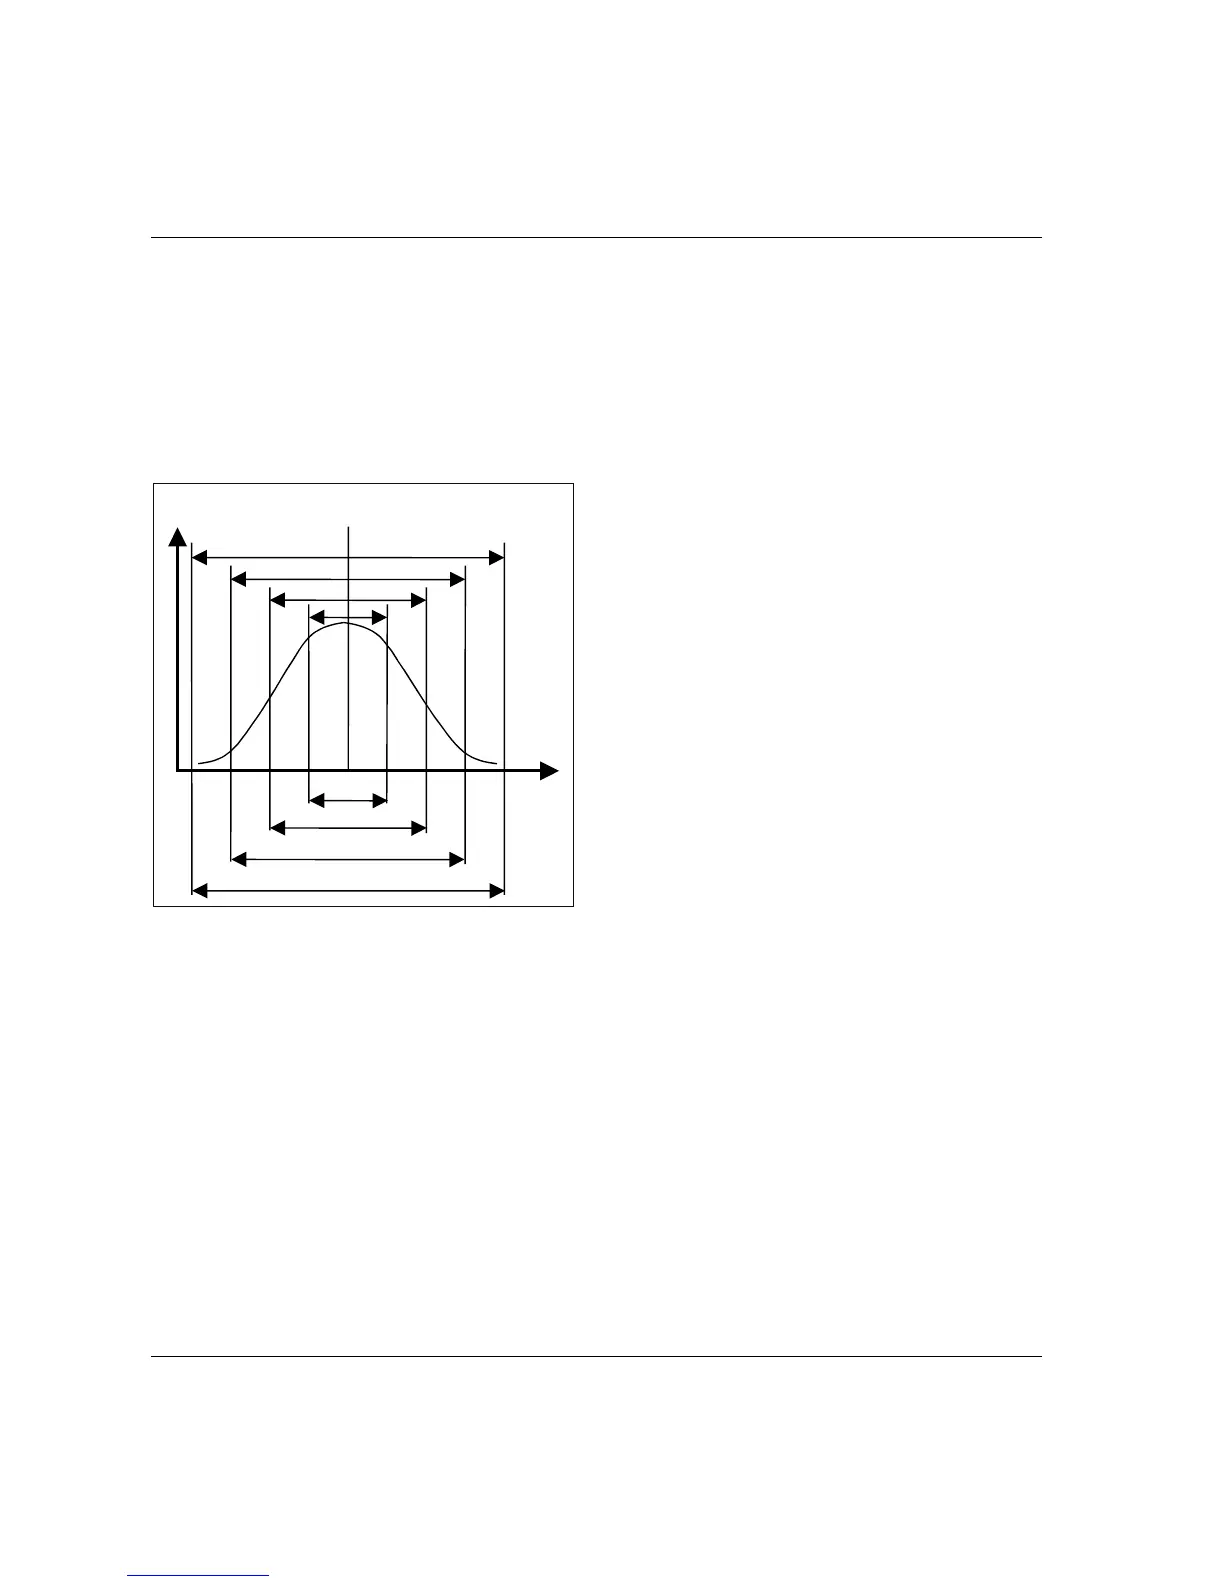
The statistics enables us forecast to reproducibility. The integral value of the normal distribution (not
defined in this manual) equals the probability of making future observations in any interval of x.
The normal distribution is defined for all x, but within the context of Process Variation we only consider a
finite interval of x from −3σ to +3σ centered on the mean. It is hereafter symbolized by 6σ and referred to
as Six-Sigma since it spans the interval of six sigma x.
The probability of making future tightening operations within the interval from −3σ to +3σ is 99.73 %.
Figure 2 illustrates that and other intervals:
Figure 2 Sigma and the normal distribution
9.2 Control charts
The calculation procedures (algorithms) used in Statistical Process Control (SPC) and Measurement
System Analysis (MSA) are designed to spot deviations from the normal distribution.
An important tool for statistical process operations is the control chart. The idea is to control industrial
processes by measuring one or several parameters that indicate the quality of the process outcome.
If the process is undisturbed, the variations will follow the normal distribution due to inevitable
randomness. If extra variations occur, it indicates a problem in the industrial process.
99.994%
68.26%
-
σ
+
σ
-2
σ
+2
σ
95.44%
99.73%
-3
σ
+3
σ
-4
σ
+4
σ
μ

 Loading...