ACTA 4000 User Guide Printouts from ACTA
9836 4171 01 2008-12 115 (136)
Trends can also be detected in a control chart. For example, several X-bar points on the same side of the
centre line may indicate tool wear.
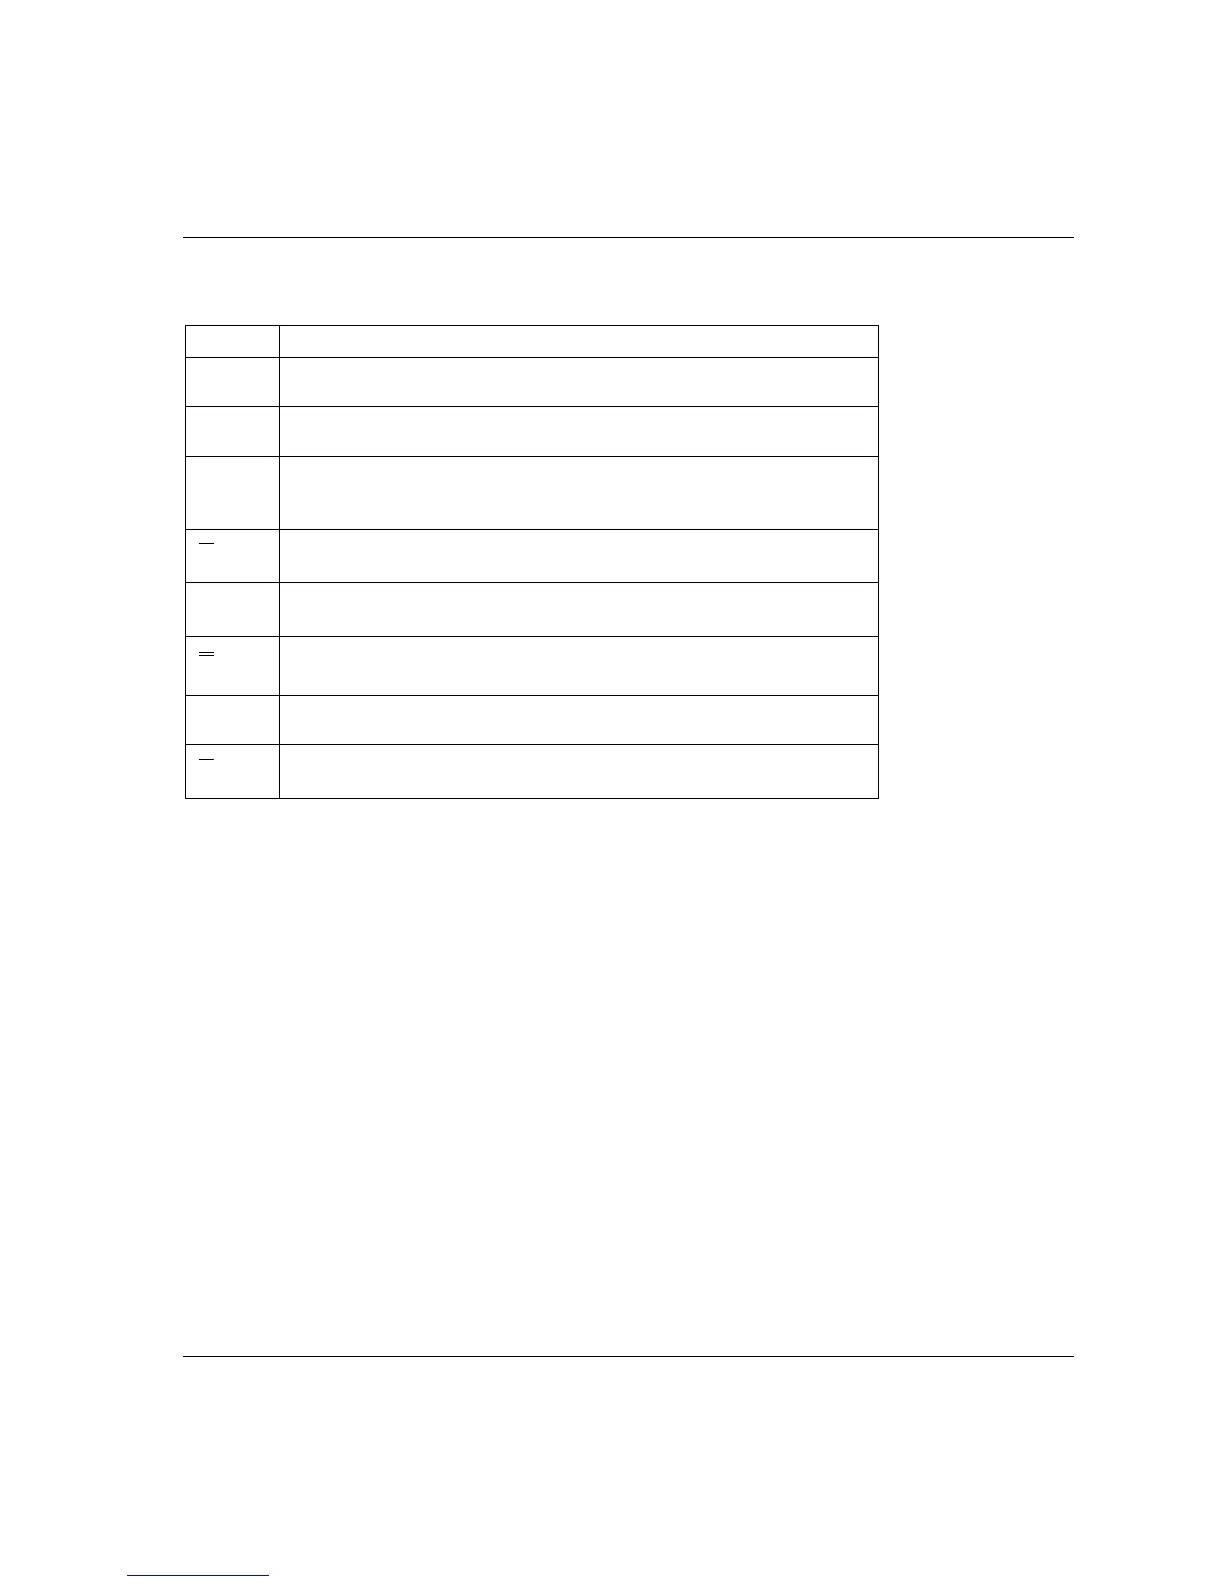
Symbol Meaning
N
Number of individual measurements in the complete set (all groups)
n
Group size, number of individual measurements in group
P
Number of groups P=N/n, disregard remainder unless for calculating
Centre Line
X
X-bar; mean of a group of individual measurements (upper case X)
j
Index digit of a series of groups
X
Centre Line, mean value of all N samples (Equation 7)
R
Range; difference between maximum and minimum x
i
in a group
R
R-bar; mean of a series of ranges
Table 2 R and X-bar control chart parameters
9.2.1 Control charts example
Two common control charts are:
Range (R) chart, for examining the variation of a process
Group average (X-bar) chart, for examining the level of a process
All processes have an inherent and unavoidable randomness. We therefore expect measurements to be
distributed as the normal distribution predicts if both process and measuring is sound.
Assume, for example, a process with a target value of 75 for a parameter. Figure 3 shows an example plot
of N=100 m
easurements. This type of plot offers very little conclusive information.
 Loading...