236 | Monitoring Dell PowerConnect W-Series Instant Access Point 6.2.0.0-3.2.0.0 | User Guide
Overview
The Overview section displays the common RF metrics for the selected access point over the last
15 minutes. The following graphs are displayed for the selected W-IAP:
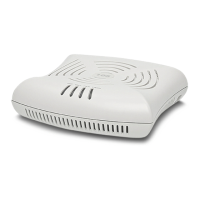
l Neighboring APs
Figure 178 - Neighboring APs Graph
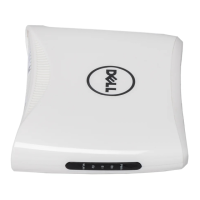
l CPU Utilization
Figure 179 - CPU Utilization Graph
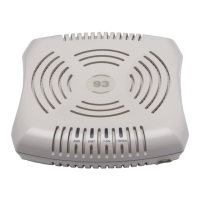
l Neighboring Clients
Figure 180 - Neighboring Clients Graph
l Memory Free (MB)
 Loading...