Eclipse Additional Information Page 16
3.2 Brief Introduction to ABR
When a well-functioning ear is stimulated with sound electrical activities are generated within the cochlea as
well as in the combined nerve system connecting the cochlea to the brain. The cortex itself also generates
electrical activities when a sound is processed at these high levels of brain activity.
All of these electrical activities spread to a certain degree through the surrounding tissue and are therefore
also present, though at a very low level, on the outer surface of the head, at the earlobe, within the ear canal,
etc. The electrical potential generated by the brainstem as a result of sound stimulation is around 100nV
upto 1µV when measured in the far field (on the surface of the head), and picked up by electrodes placed in
relevant locations on the head or in the ear canal.
Unfortunately many other electrical activities are present on the surface of the head. These originate from
brain activity, muscle activity etc. Such activities generate electrical potentials at the head normally around
20µV. The largest contributor to this is muscle activity.
When we need to record the AEP (Auditory Evoked Potentials), we are facing the problem of the very poor
signal to noise ratio explained above. The solution is simple in theory, and it is based on the fact that the
noise is random in character, while the AEP signal follows the same exact pattern every time a given sound
is presented to the ear. During testing the sound stimulus is presented to the ear many times, each time fol-
lowed by a recording of the AEP in a time window starting at stimulus onset and running for a certain number
of milliseconds. Remember that this signal contains two parts: 1) a very small signal stemming from the
nerve activity related to the sound stimulation, and 2) a much larger signal from muscles and unrelated brain
activity which for the purposes of our test we regard as electrical noise. All the recordings are then simply
added together and their average value is calculated at each point in the time window. What will be the aver-
age then at any given point? Well, let us look at the noise part of the signal first.
Remember that the noise was random in character, so chances are that there will be as many negative elec-
trical values as there will be positive electrical values. And here comes the point: When averaged the posi-
tive values will tend to cancel out the negative values. This is why often several thousand stimuli are pre-
sented, so we can get thousands of samples to contribute to this averaging process to make the noise disap-
pear. But what about the signal content we are looking for - the AEP?
Luckily, that is the same every time we stimulated with our sound stimulus. Imagine after 6ms from stimulus
onset, you have the presence of the signal albeit at a very low level. As the high level noise has disappears
due to our averaging process described above, we will now be able to see this very small ABR signal.
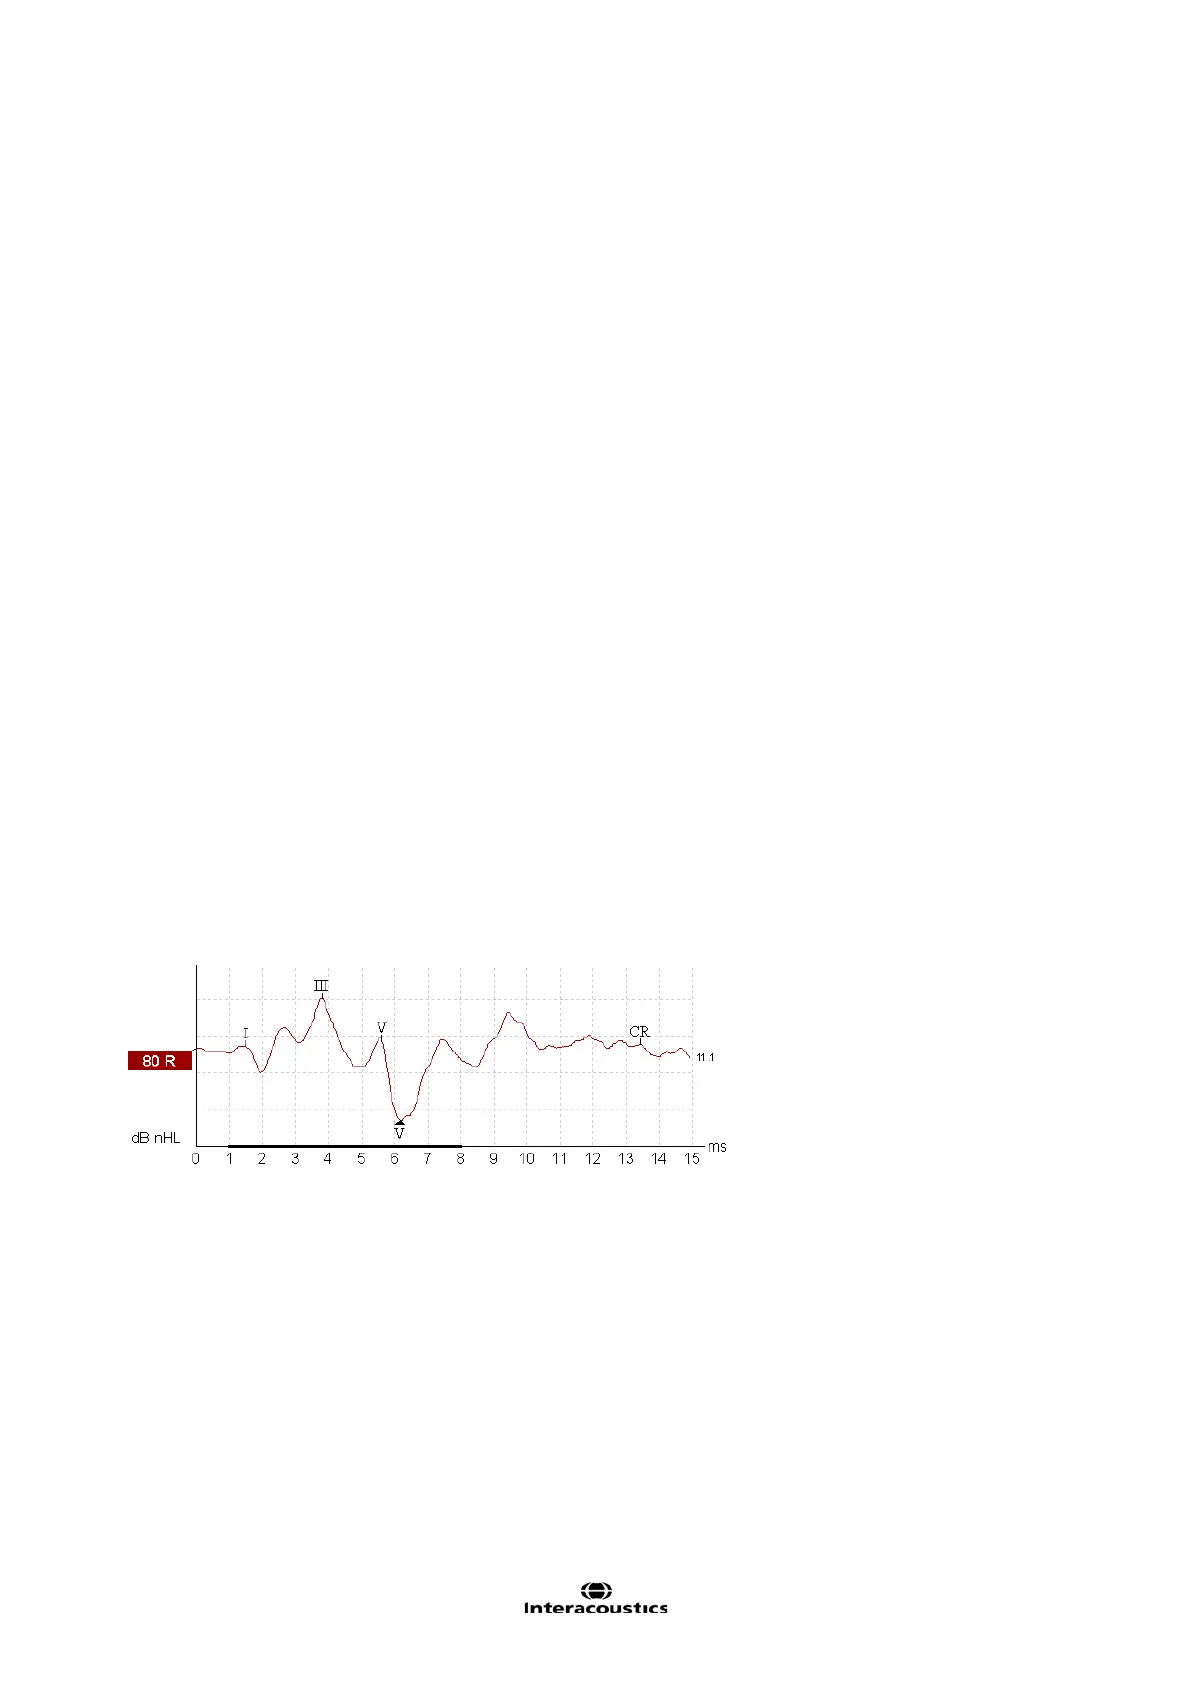
Example of the auditory brainstem response (ABR) neuro testing:
Remember that it is a recording of electrical nerve activity resulting from a sound stimulus. It is therefore not
a test of hearing in the traditional sense.
As transmission time through the nervous system is well known, it is possible to concentrate on various
points in time relative to stimulus onset. The longer the time window, the deeper can we look into the brain.
Please refer to the quick guides to see and read more about the various AEP tests.
 Loading...