Eclipse Additional Information Page 34
3.6 Latency tab
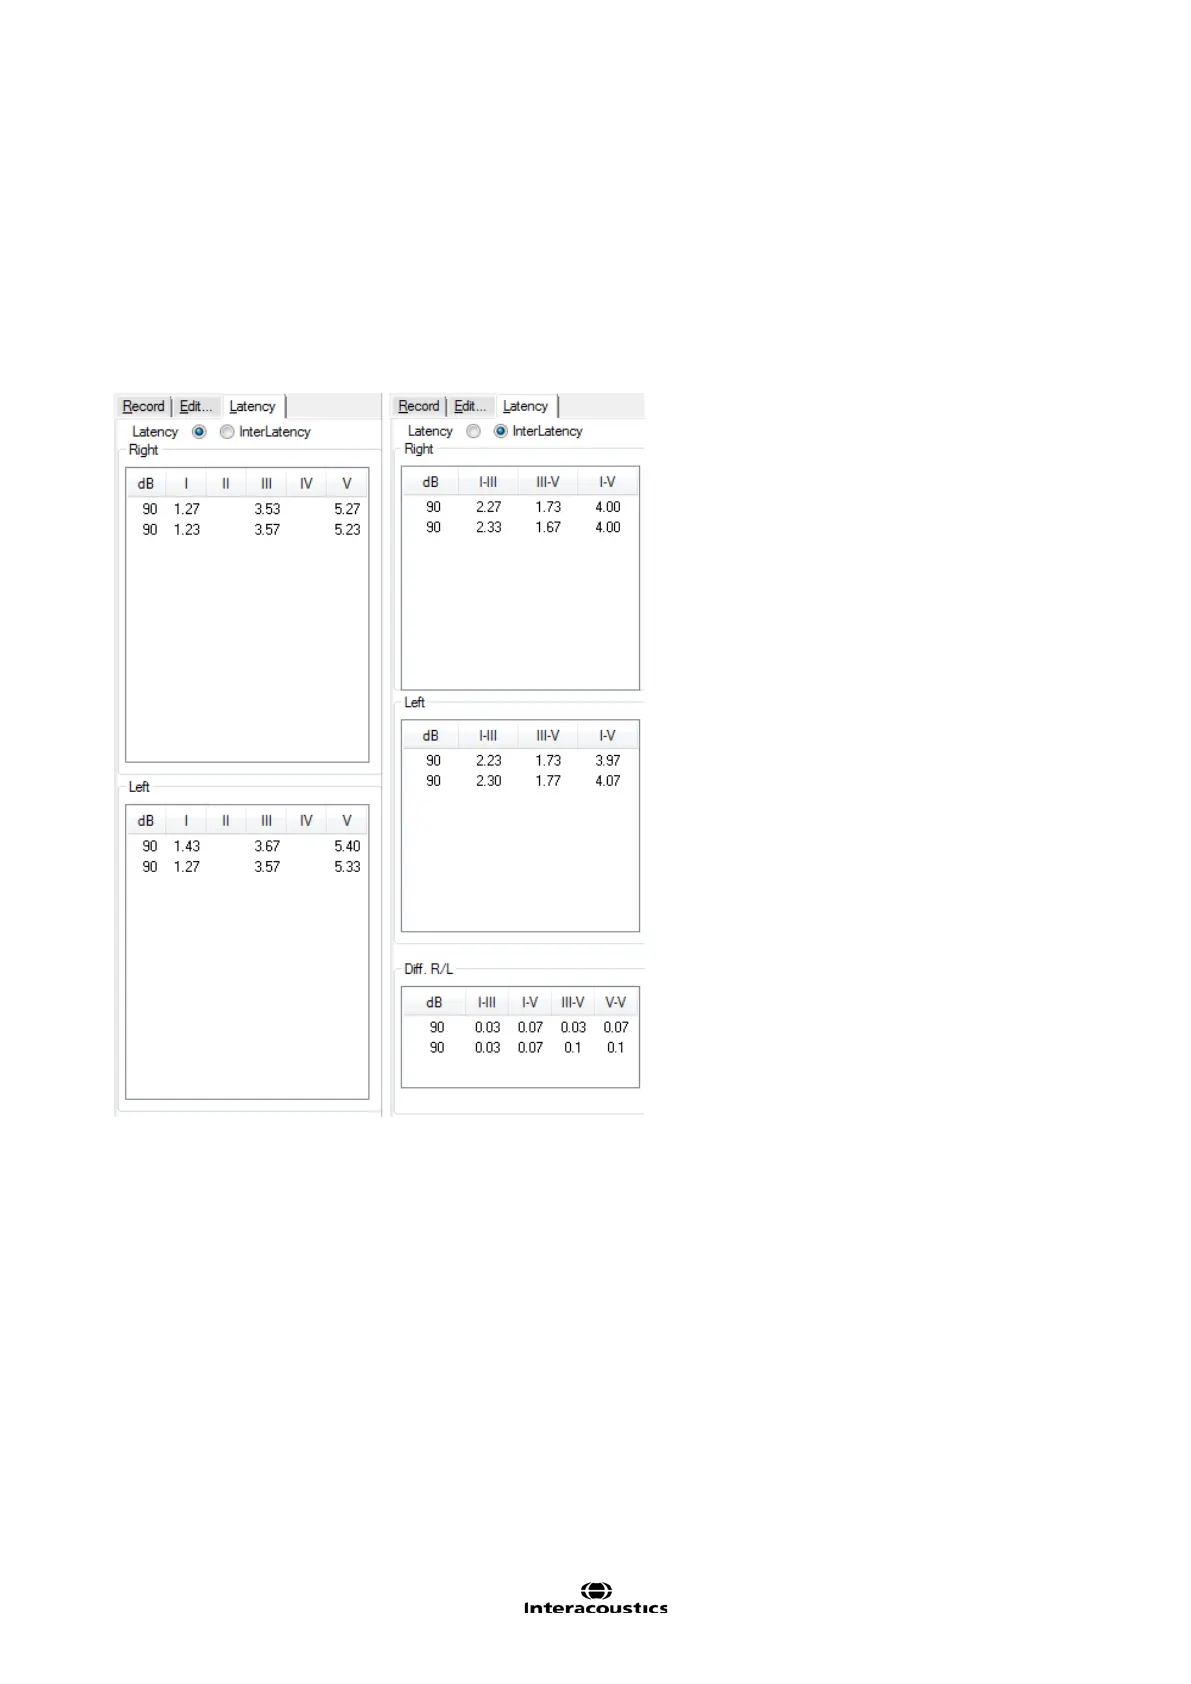
Click the tab Latency to enter the Latency window.
Left panel
The two boxes on the left part of the screen provide the latencies of all Waveform Markers assigned to the
curves in this session for right and left ear (see below, left). When selecting InterLatency the information at
the right in the picture below will appear. The view of the inter-latency is split into Right, Left and the differ-
ence between R and L for peak inter-latencies as shown below. This information is used in the interpretation
for the ABR.
ABR Latency norms
ABR Latencies are plotted against intensities and a shaded area indicates the latency template data. This
allows for an easy interpretation of latency change relative to the change in stimulus intensity. To assist in
the diagnosis, a grey shaded area of normal responses will be shown providing a latency template has been
entered in the System Setup. Data for gender and age are taken from the database to provide a correct se-
lection of the latency template.
 Loading...