Eclipse Additional Information Page 18
3.4 General Operation of EP 15/25
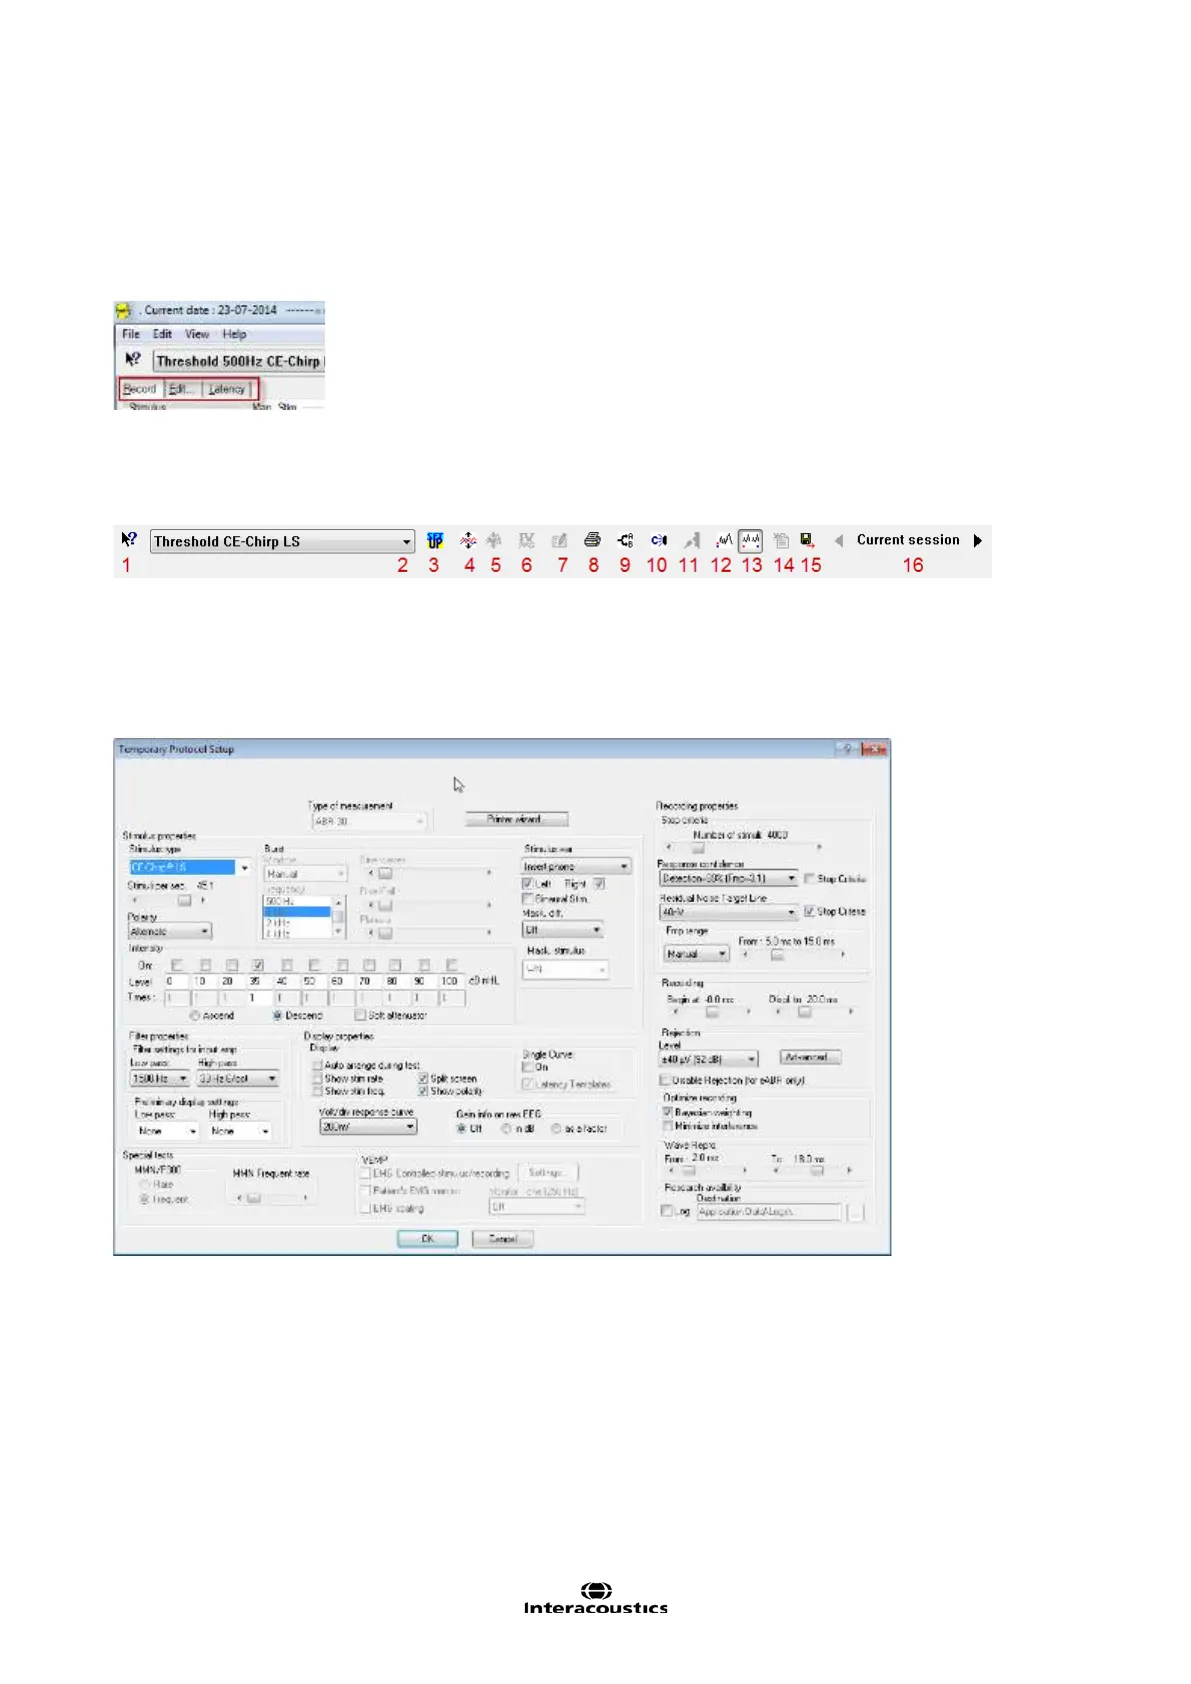
The Toolbar is always available during testing. In the left side of the screen, there are the tabs Record, Edit,
and Latency. The Record tab shows the recording screen, the Edit tab will allow you to edit and mark your
current and measured data and the Latency tab lets you examine the latency differences between the
measured peaks. Please refer to the Record, Edit & Latency chapters for more information.
3.4.1 Toolbar
1. Help launces the help function if available.
2. Protocol Selection lets you select from the default protocols available.
3. Temporary Protocol Setup brings you a dialog of from where you can make temporary changes before
and during measurements. Changes will apply to this session only. The test protocol name will then be fol-
lowed by an * to indicate modified contents. Possible changes vary based on the selected protocol and is
limited in relation to the Auto Protocol Setup.
4. Rearrange curves during test arranges curves with equal distance between them.
5. Group Curves automatically groups waveforms with identical parameters (e.g. stimulation levels) on top
of each other for easy comparison of wave reproducibility. If any parameter is changed (e.g. stimulation rate
or stimulus type), such different waveforms will not be grouped together by this function even though they
have the same stimulus level.
6. Suggest waveform markers: Pressing Suggest Waveform Markers will show suggested markers for
which Normative Data exists at the most dominant peak within the assigned normative data range. This
means that a peak falling outside the normative data range will have its Waveform marker plotted only as
close to the wave peak as the latency template range allows. This makes it easy to evaluate whether Wave-
form Markers are within normative range or not. Sometimes a Waveform Marker may be placed far from the
correct position. This happens if the correct position is not the maximum point within the norm data range.
 Loading...