Eclipse Additional Information Page 31
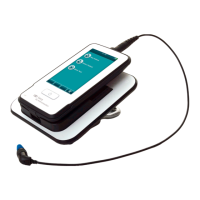
The above markers CR, RA & INC are shown on the Printout together with other relevant parameters such
as the area ratio. Further, note the Ratio in the table indicating 2.9. That is the ratio of interest when compar-
ing peak V and trough V (SN10).
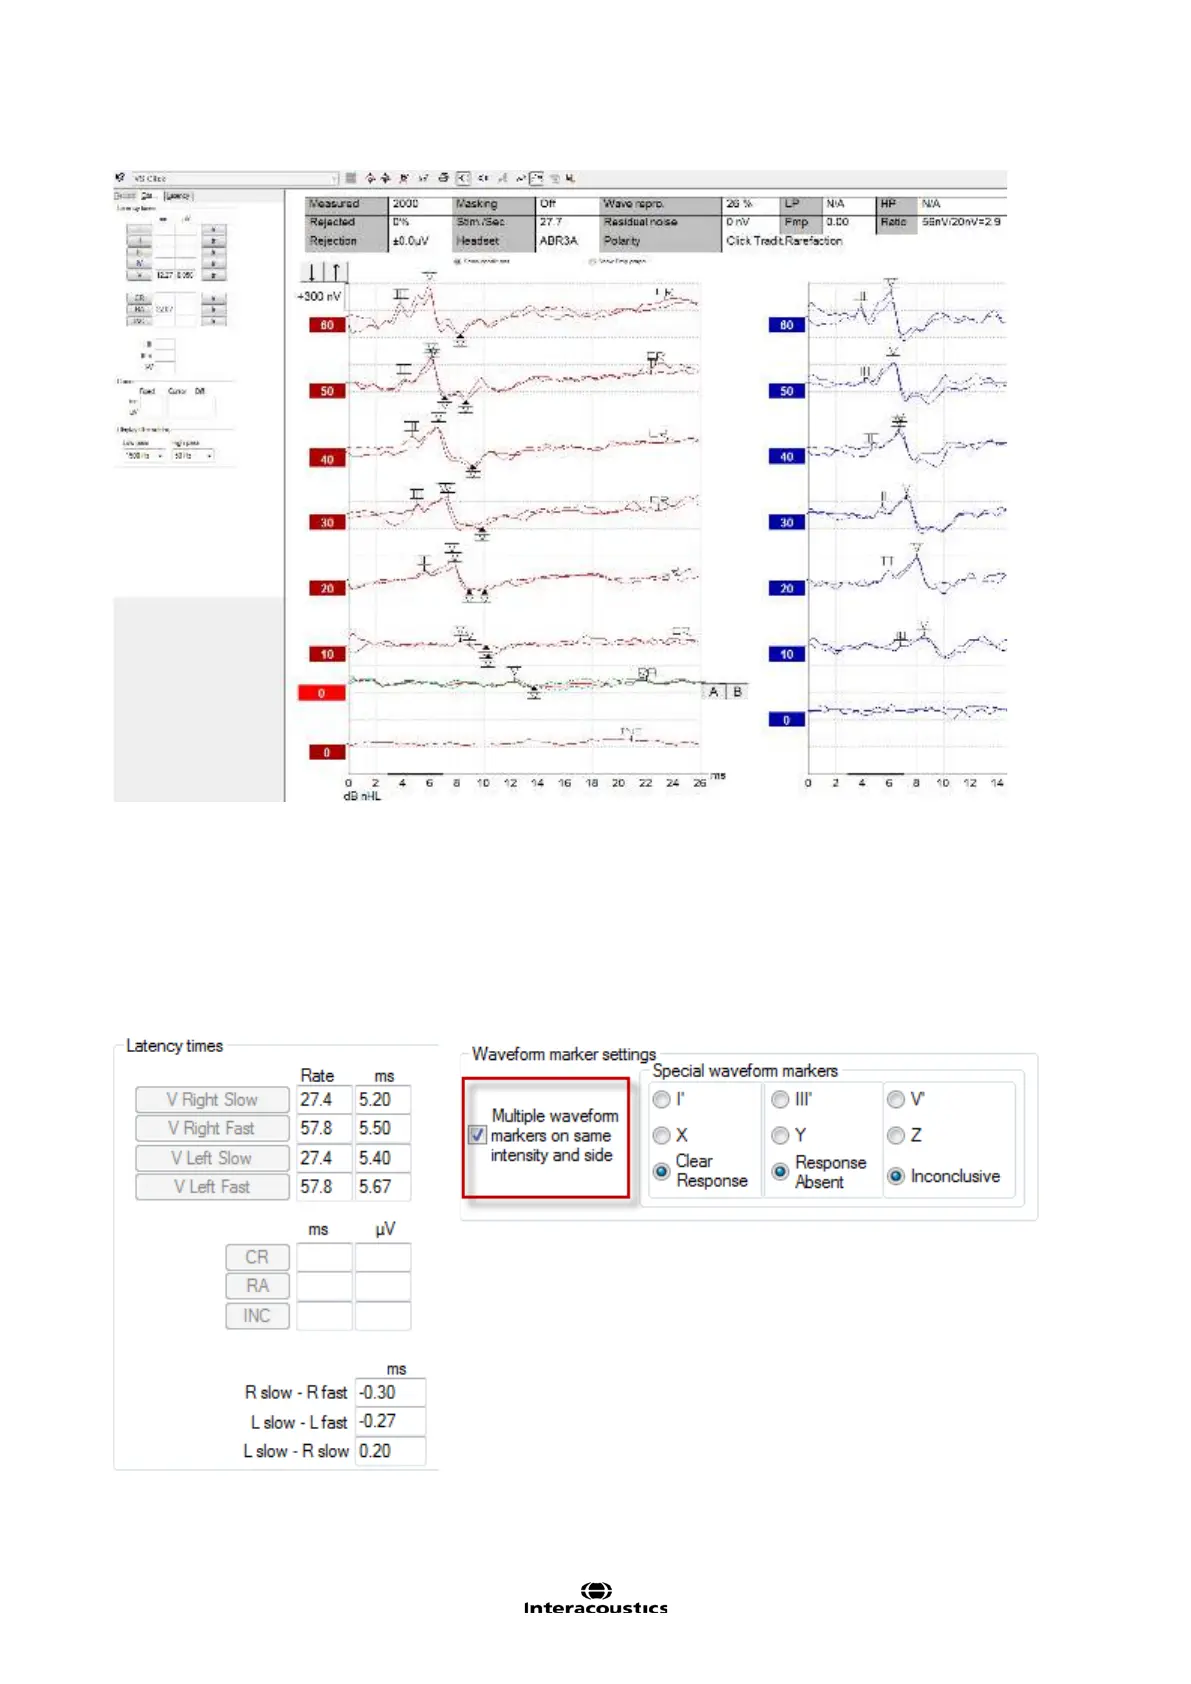
3.5.1.1 Latency times
When Multiple waveform markers on same intensity and side is selected the view of the latency times is
shown on the left of the screen and multiple peaks and troughs can be marked. This screen provides infor-
mation about the difference between the slow and fast rate in ms for each ear individually, and the difference
between the two ears.
 Loading...