Eclipse Additional Information Page 20
Note The display gain may be presented at display gains different from the default 100µV per division, if
Auto Single Curve Display Gain is selected in the General Setup.
13. Split Screen Split Screen function will display Right and Left waveforms on separate sides of the screen.
The various view options can be changed prior to, during and after testing by clicking on the split screen icon
for optimal flexibility for the user.
14. Save & new session saves your recording and continue with a new session. This feature is used to con-
tinue patient testing with different protocol from the list.
15. Save & exit saves the recording and returns to the patient database. The session will be saved in the da-
tabase. Any modifications to the test results must be carried out prior to saving the original session, as lim-
ited only subsequent editing in historical sessions is allowed. If no data was recorded a session will not be
saved.
When editing, the session date remains unchanged in the database as this always refers to the date of the
recording. In case you want to exit without saving anything, click on the “x” in the upper right hand corner.
16. Session: Indication of historic session date, if multiple sessions are available you can shuffle between
sessions with the arrows. The toggling of session can also be done with the keys PgUp and PgDn.
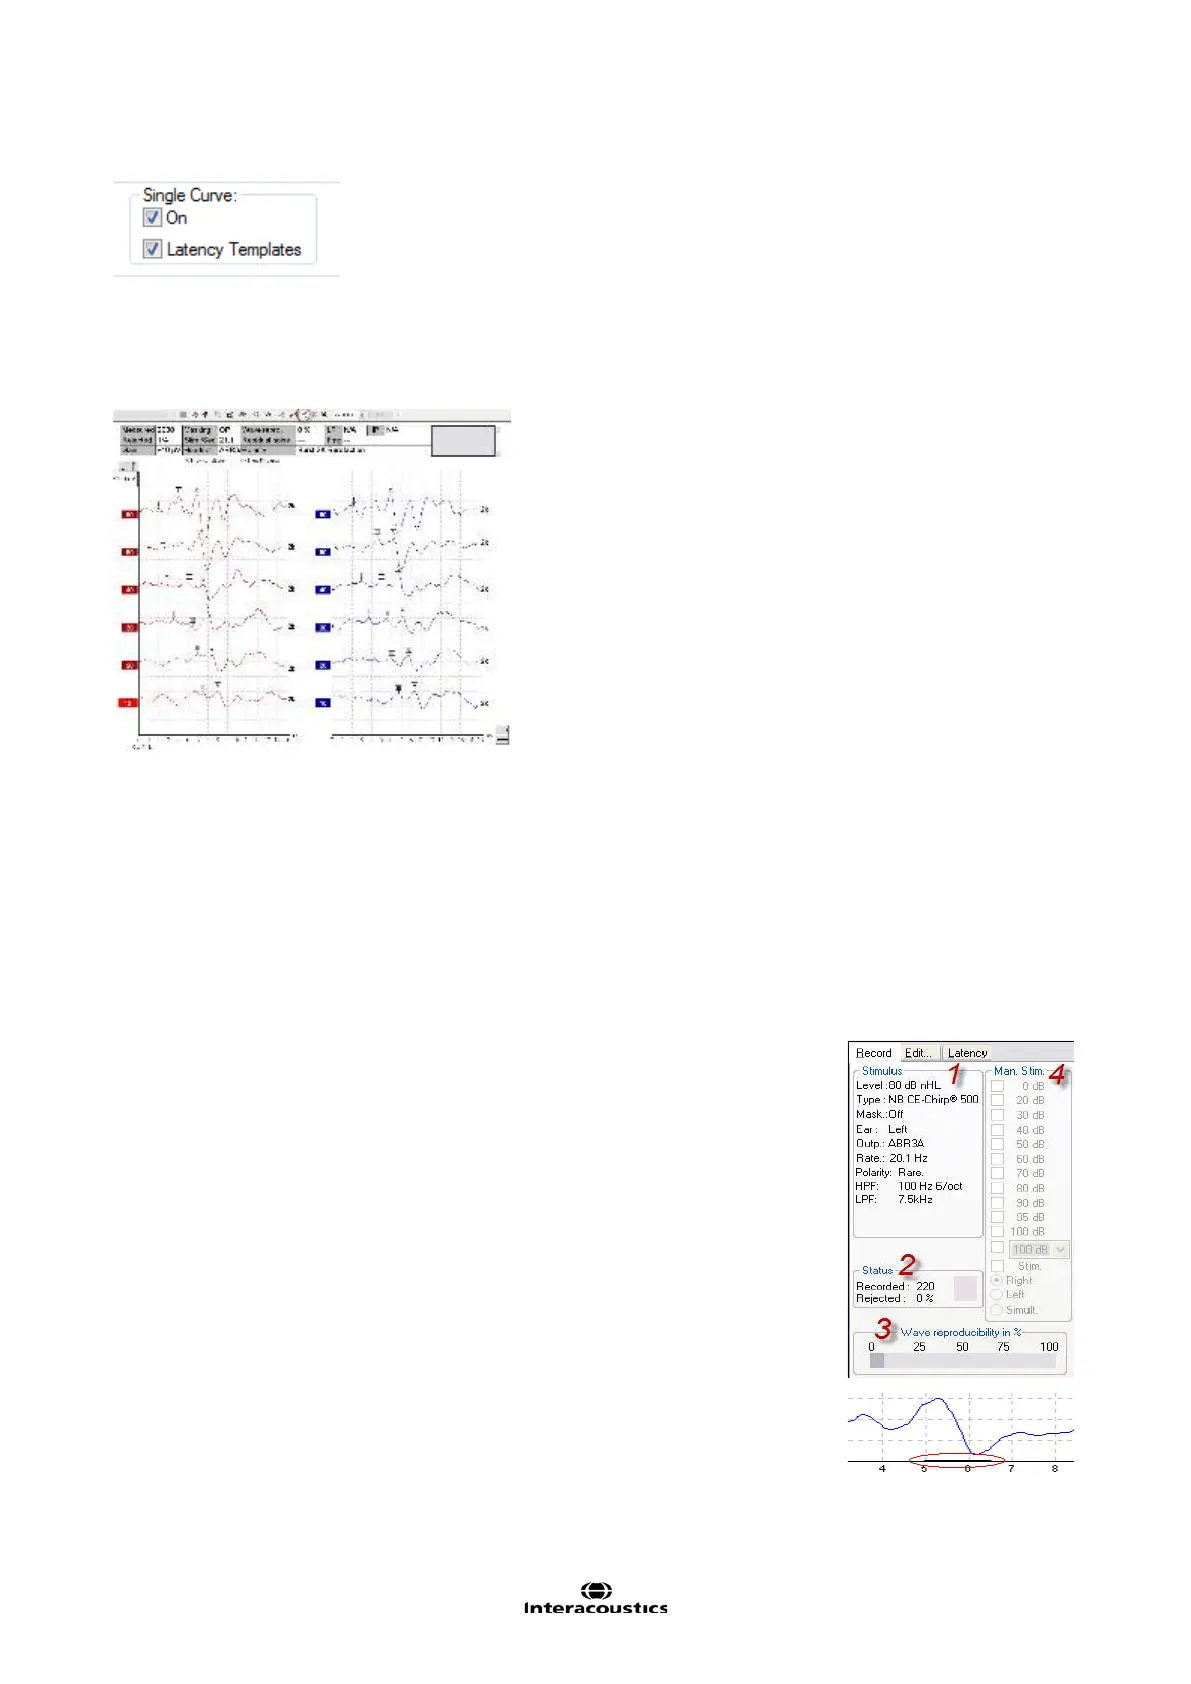
3.4.2 Record tab
1. Stimulus: The Stimulus window shows the stimulus parameters for the curve
currently being recorded including ear and intensity.
It informs you of the type of stimulus, whether masking is applied and which
transducer is used. You can change the transducer in the temporary setup or
you can set a different transducer as default for this protocol under System
Setup | Auto Protocol tab.
Note changing transducer must take place prior to recording.
2. Status: Shows the number of accepted sweeps together with the number of
sweeps being rejected (percentage).
3. Wave Reproducibility: When a test is performed, an A buffer and a B buffer
exists and each holds half of the responses. A correlation (similarity) between
the two curves is indicated using a percentage bar.
The correlation calculation is part of the test parameter setup and is indicated by
the bold line parallel to the time scale. You may change the width or position of
this bold bar simply by dragging it by its ends or by grabbing it with the mouse
and sliding it back and forth along the time scale. Wave reproducibility will be re-
calculated immediately according to the new time window.
 Loading...