Chapter 7: Status
Disk Usage
Quantum DXi6900 User’s Guide 182
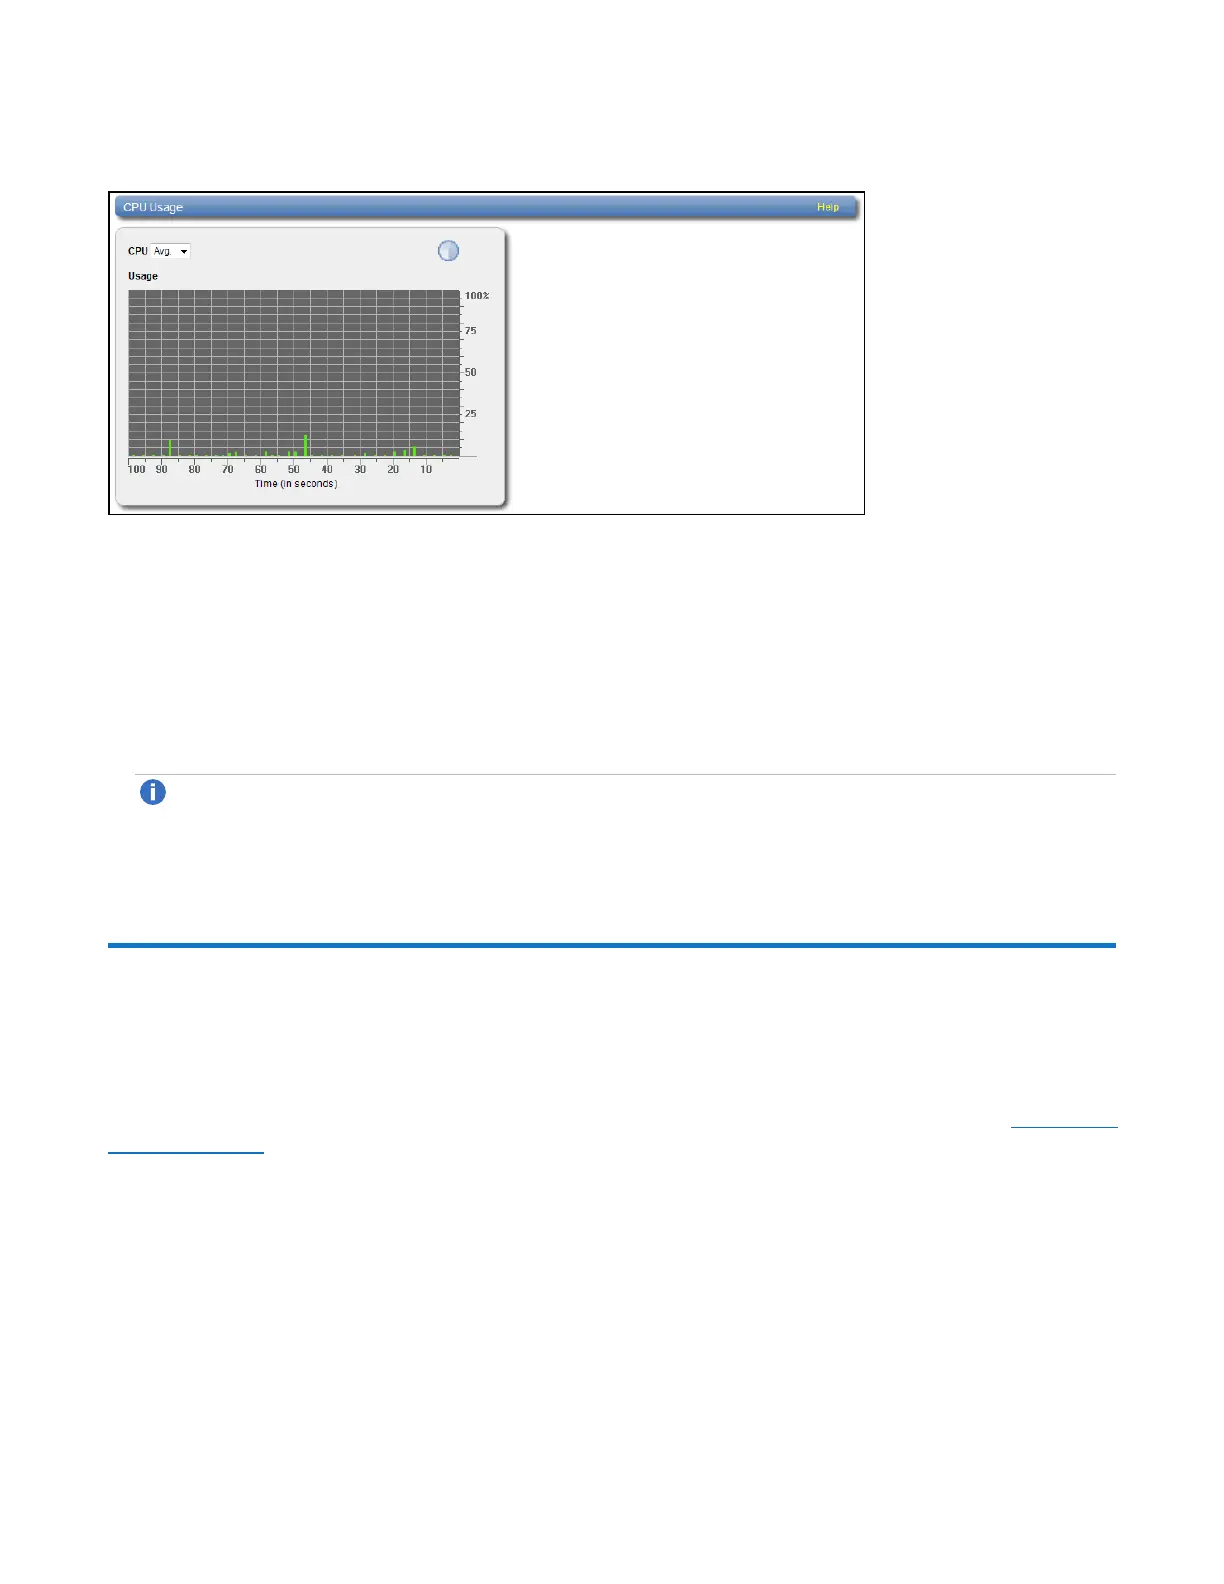
Figure116:CPU Page
Use the CPU page to display recent CPU usage in a dynamic graph:
l Select the CPU core to monitor in the CPU drop-down box, or select Avg to display an average of all
CPUs.
l The CPU drop-down box lists all CPU threads. Each hyper-threaded CPU core counts as two threads.
l The horizontal axis displays time (0–100 seconds).
l The vertical axis displays CPU usage (0–100%).
Note:Each bar on the graph represents approximately 1 second of time.
l Hold the cursor over a bar to display the value of the bar.
Disk Usage
The DiskUsage page allows you to view information about free and used disk space on the system. You
can also view data reduction statistics.
To access the DiskUsage page, click the Status menu, and then click the DiskUsage tab (see Figure 117
on the next page).
 Loading...