Chapter 3: Remote Management
The Remote Management Console
Quantum DXi6900 User’s Guide 69
The Remote Management Console
After you log on to the DXi6900, the remote management console displays. The remote management
console includes the following features:
System Banner
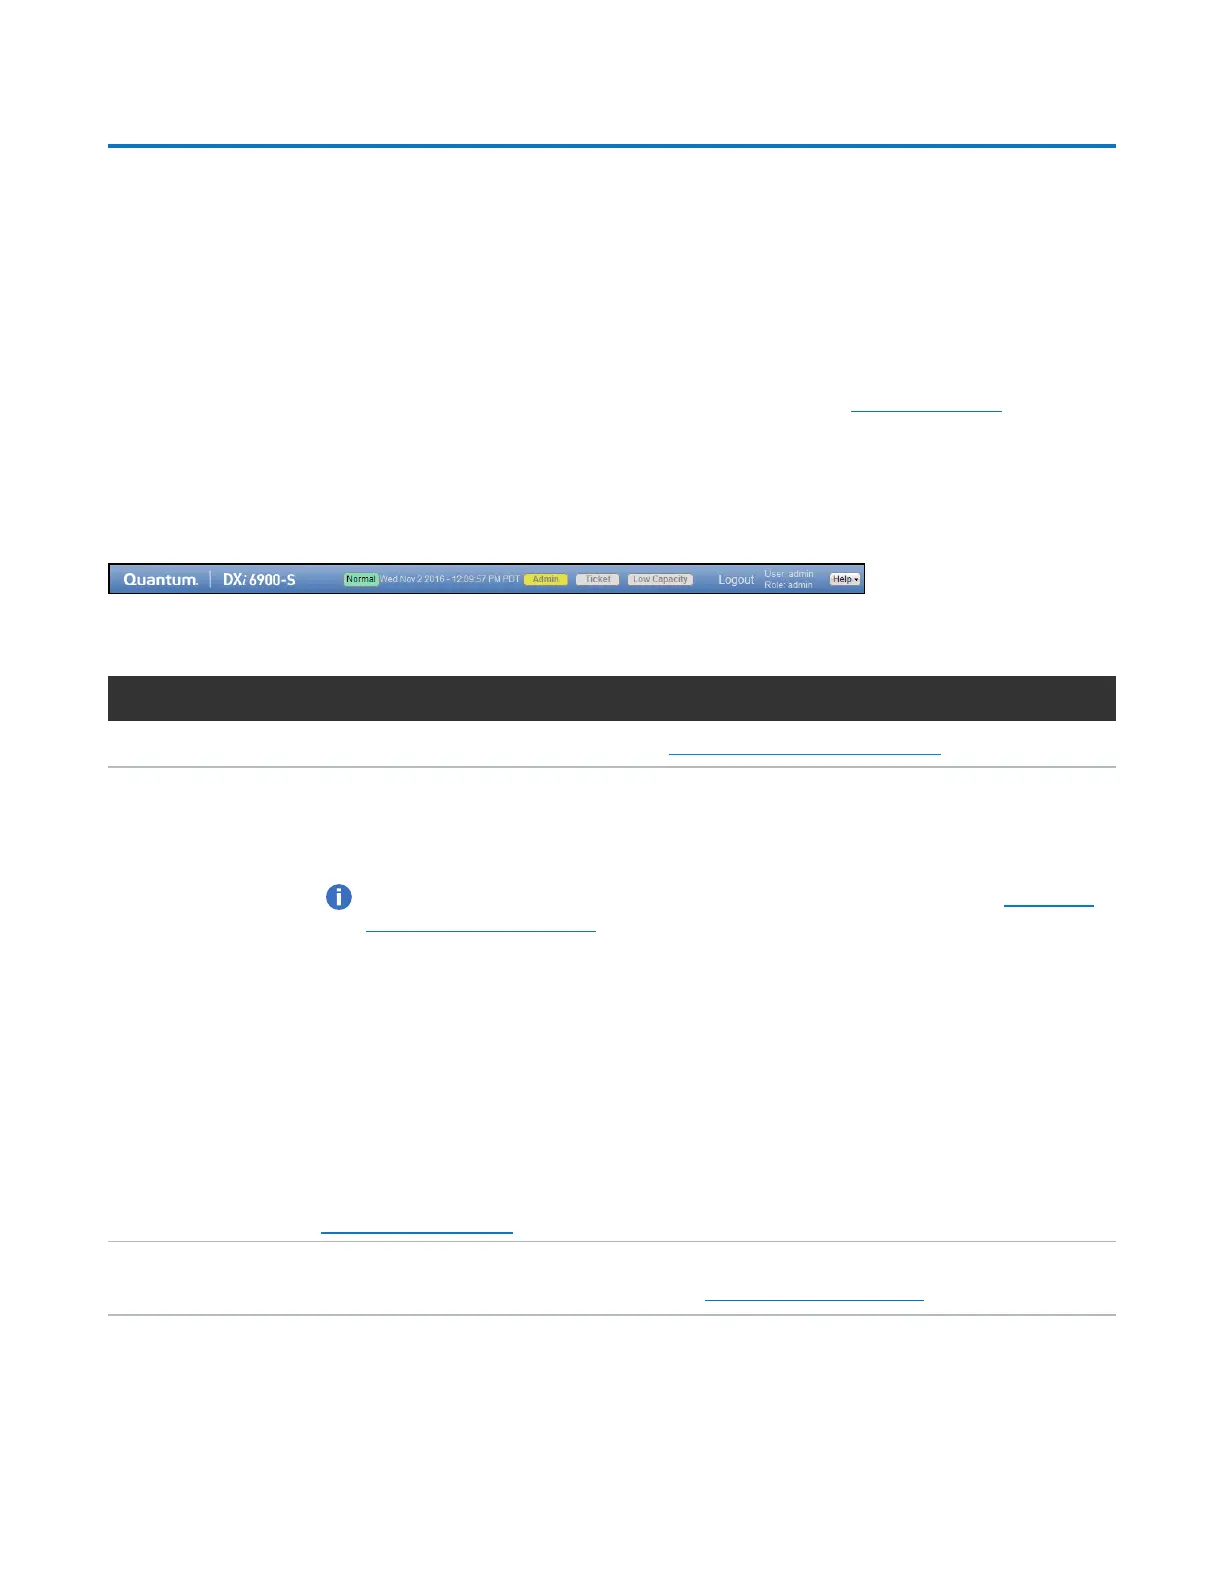
The system banner displays at the top of the remote management console (see Figure 38 below). Use the
system banner to see overall system status and alert information at a glance, and to quickly access
additional information. The system banner also displays the time and date as well as the login type
(administrator or monitor).
Figure38:System Banner
The following items display on the system banner.
Item Description
ModelNumber The model number of the DXi6900 (see Model Number on the next page).
Status
Displays the operating state of the DXi6900:
l Normal - (Green) The system is operating correctly.
l Attention - (Yellow) There is a problem with the system.
Note:The state displays Attention during a blockpool verify operation (see Blockpool
Verify Behavior on page 72).
l VerifyFailure - (Red) The blockpool verify process has failed.
l LowSpace - (Yellow) Available disk space is low. Ingest and replication continue, and
space reclamation starts.
l CriticalReserveSpace - (Red) Available disk space is critically low. Ingest and
replication are stopped, and space reclamation continues.
l NoSpace - (Red) There is no available disk space. Ingest and replication are stopped,
and space reclamation continues.
Click the Status button to display detailed status information about the system (see
Hardware on page 170).
Admin The Admin button turns yellow when an administration alert occurs. Click the Admin
button to manage administration alerts (see Admin Alerts on page 196).
 Loading...