6 Image Acquisition
Operator’s Manual 6 - 15
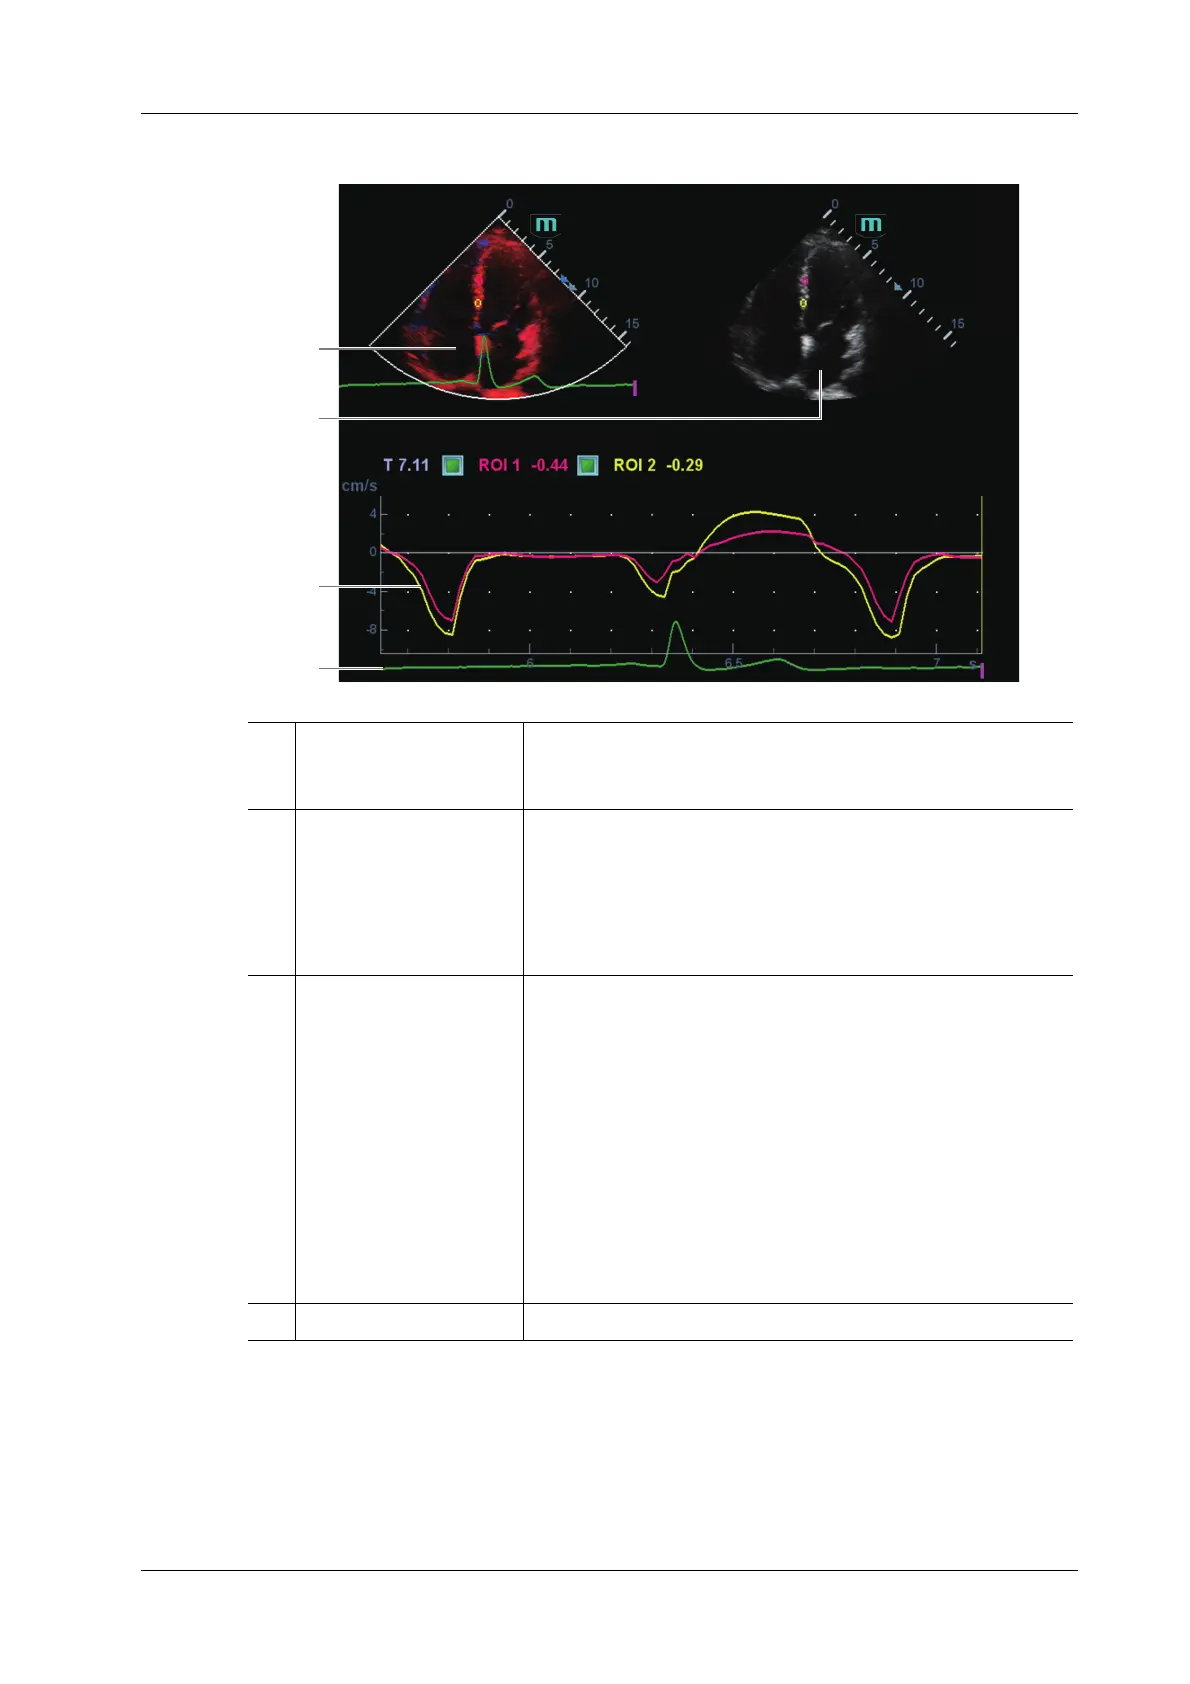
Figure 6-1 Quantitative analysis display (taking velocity-time curve as the example)
Perform the following procedure:
1. Scan the image with the moves of myocardium on, freeze the image and select the scan scope,
or open the image which includes the myocardium moves already.
1 TDI review Sampling area: indicates the sampling position of the curve. The
sampling lines are marked with color numbers. It can mark 8
ROIs at most.
2 2D grey image review • Use the trackball/trackpad; the images in TDI review
window and 2D review window are reviewed synchronously,
since the two images are frozen at the same time.
• ROI movement is linked between the TDI (Tissue Doppler
Imaging) review window and the 2D imaging reviewing
window.
3 Display analysis curve • Y-axis represents the velocity (unit: cm/s) [in strain-time
curve, Y-axis represents the strain (%); in strain-time curve,
Y-axis represents the strain (unit: 1/s)].
• X-axis represents time (s);
• Frame mark: a white straight line perpendicular to the X-
axis, and can be moved left and right by using the trackball/
trackpad.
• Click the check box in front of the ROI to display or hide the
analysis curve.
• You can get the current X/Y axis value by moving the cursor
onto one point on the curve; and if you press <Set> at this
time, the frame marker will move to the spot.
4 ECG display area /
2
1
3
4
 Loading...