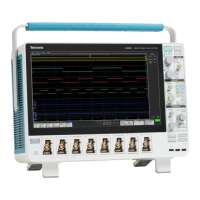
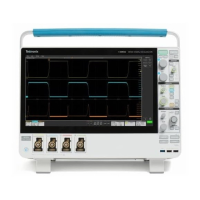
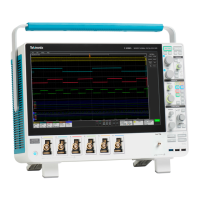
The SOA measurement adds a Power measurement badge to the Results bar, and automatically adds the SOA plot to the
screen.
6. Double-tap in the Plot view to open a configuration menu for that plot.
Display a power Switching Loss (SWL) Trajectory plot (optional)
Use this procedure to display a trajectory plot for a power measurement.
To display a trajectory power plot, you must be taking a Switching Loss measurement (Add New... Measurement > Power tab >
Switching Analysis panel > Switching Loss measurement).
1. Double-tap the Switching Loss measurement badge to open the configuration menu.
2. Tap Trajectory Plot to add a new Trajectory Plot view to the screen.
3. Double-tap in the Plot view to open a configuration menu for that plot.
Display instantaneous power and energy plots from the Power Quality
measurement. (optional)
Use this procedure to display a power/energy plot from the Power Quality measurement.
To display the power and energy plots you must be taking the Power Quality measurement.
1. Tap the Add New... Measurement button.
2. Tap the Power tab.
3. Set the Voltage and Current sources for the measurement.
4. Tap the Input Analysis panel.
5. Select the Power Quality measurement and tap Add.
The measurement is added to the Results bar, and automatically adds PQ: Power and PQ: Energy math waveforms (plots)
to the Waveform view. Math plots are shown in the Waveform View rather than in a separate Plot view.
■
PQ: Power displays the power waveform computed from the Power Quality input sources.
■
PQ: Energy displays the energy waveform computed from the Power Quality input sources. See Waveform View
configuration menu on page 409.
Display a Harmonics Bar Graph plot for the Power Harmonics measurement
(optional)
Use this procedure to display a bar graph.
To display a harmonics bar graph, you must be taking a Harmonics measurement (Add New... Measurement > Power tab >
Input Analysis panel > Harmonics measurement)
1. Double-tap a Harmonics measurement badge.
The Measurement configuration menu is displayed.
2. Tap the Bar graph button.
Analog channel operating basics
MSO54, MSO56, MSO58, MSO58LP, MSO64 Help 103

 Loading...


