Right click menu functions associated with visual trigger areas
The following functions are available when you right click on a visual trigger area.
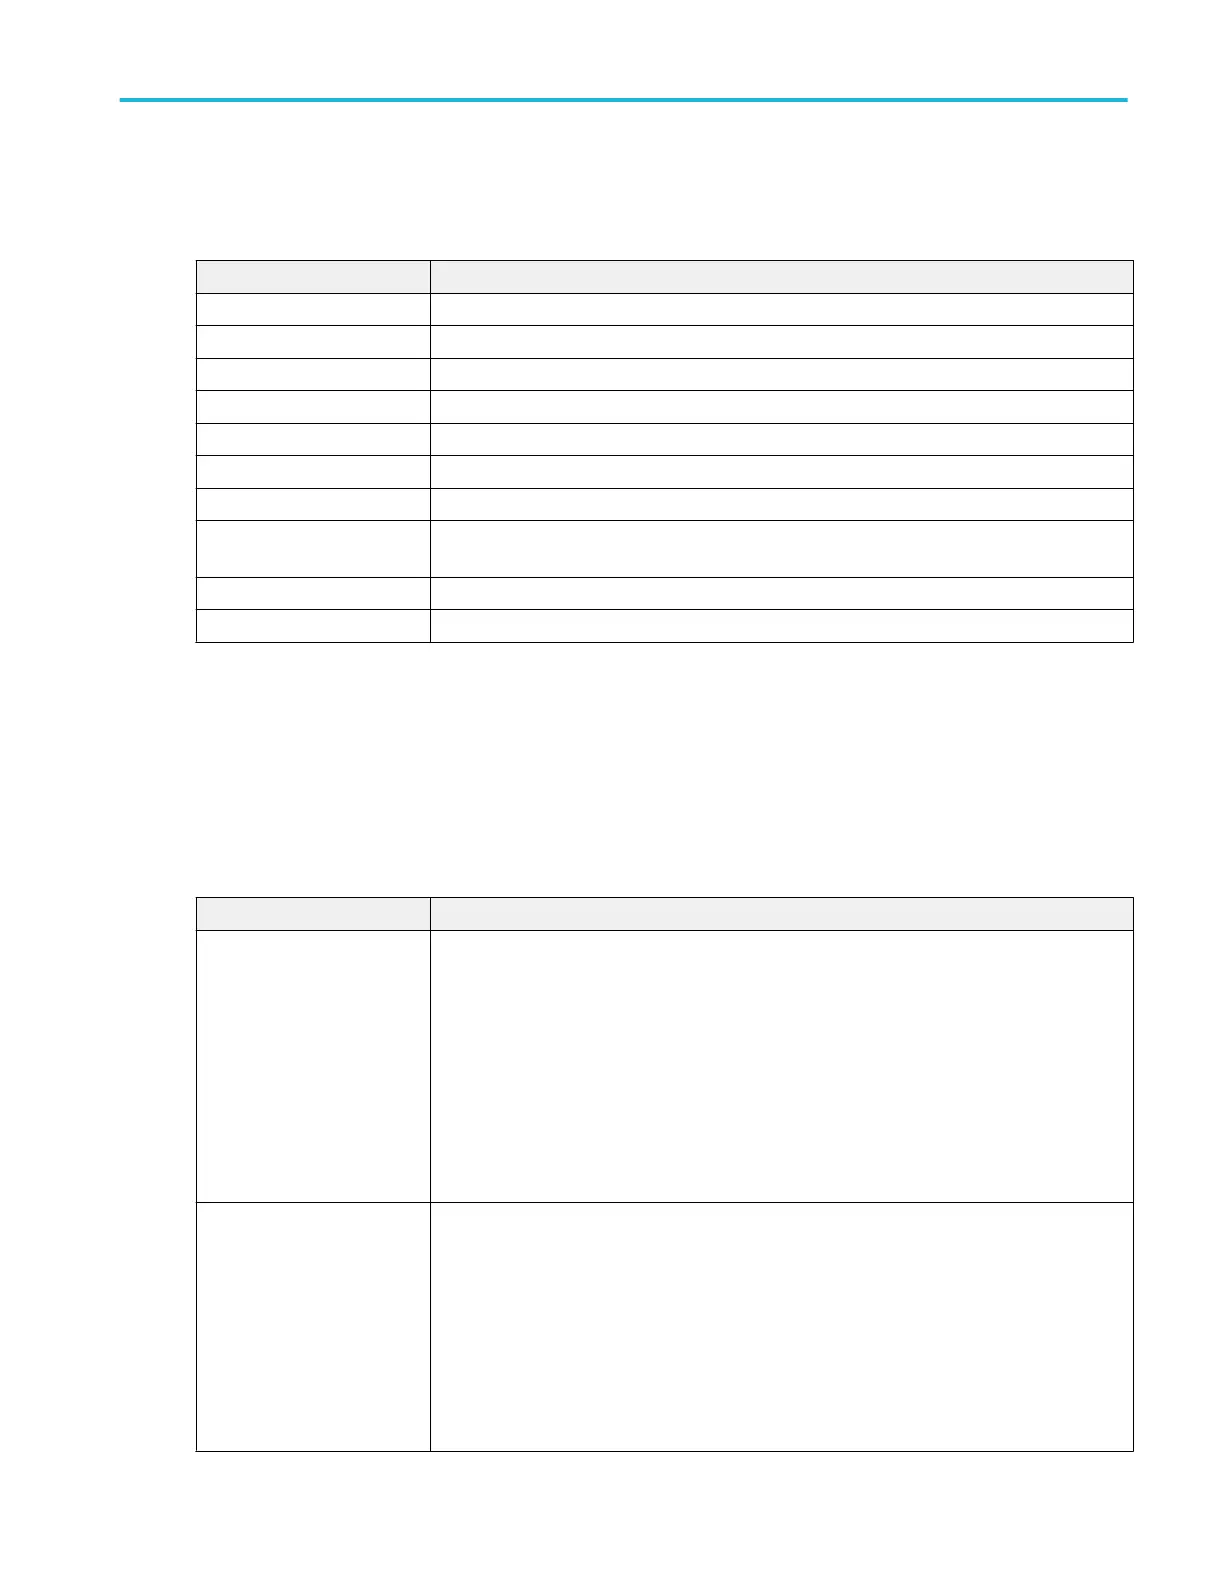
Field or control Description
In Sets the area's Waveform Must Be control to In.
Out Sets the area's Waveform Must Be control to Out.
Don't Care Sets the area's Waveform Must Be control to Don't Care.
Rectangle Sets the area's shape to a rectangle
Triangle Sets the area's shape to a triangle.
Trapezoid Sets the area's shape to a trapezoid.
Hexagon Sets the area's shape to a hexagon.
Create Duplicate Creates a new area with the same characteristics as the current area, but offset from the
original area by X+50 and Y+50.
Configure Area Opens the Area configuration menu for the selected area.
Delete Area Deletes the selected area.
Waveform View configuration menu
Use this menu to configure the Waveform View to set display mode, waveform interpolation method, persistence, and other
parameters.
To open the Waveform View menu, double-tap anywhere in the Waveform View screen.
Waveform View menu fields and controls
Fields or controls Description
Display Mode Sets how waveforms are shown on the screen.
Overlay mode displays all waveforms on the screen, overlaid on each other. This is the
traditional way that oscilloscopes displayed waveforms, and lets you overlay waveforms to do
direct comparisons of waveform shape. The grid vertical position and scale values change for
each selected waveform.
Stacked mode draws each waveform in an individual section, or slice, of the screen, stacked
one on top of the other. This lets you view each waveform uncluttered by overlaying waveforms.
Each waveform slice displays its own vertical scale units. A trigger level indicator in a slice
indicates that that waveform is the trigger source.
Interpolation Selects the method used to display record points between sampled points.
Sin(x)/x computes record points along a curve between the actual acquired samples. This form
of interpolation is useful when acquiring rounded waveforms such as sine waves. It is good for
general-purpose uses but may introduce overshoot or undershoot in signals with fast rise times.
This interpolation is also useful for looking at high-frequency signals, especially where the
frequency components are just below the Nyquist frequency.
Linear computes record points between actual acquired samples using a straight-line fit. This
interpolation is useful for measuring waveforms with fast rise times, such as pulse trains.
Menus and dialog boxes
MSO54, MSO56, MSO58, MSO58LP, MSO64 Help 409
 Loading...


