Waveform display concepts
Waveform display overview
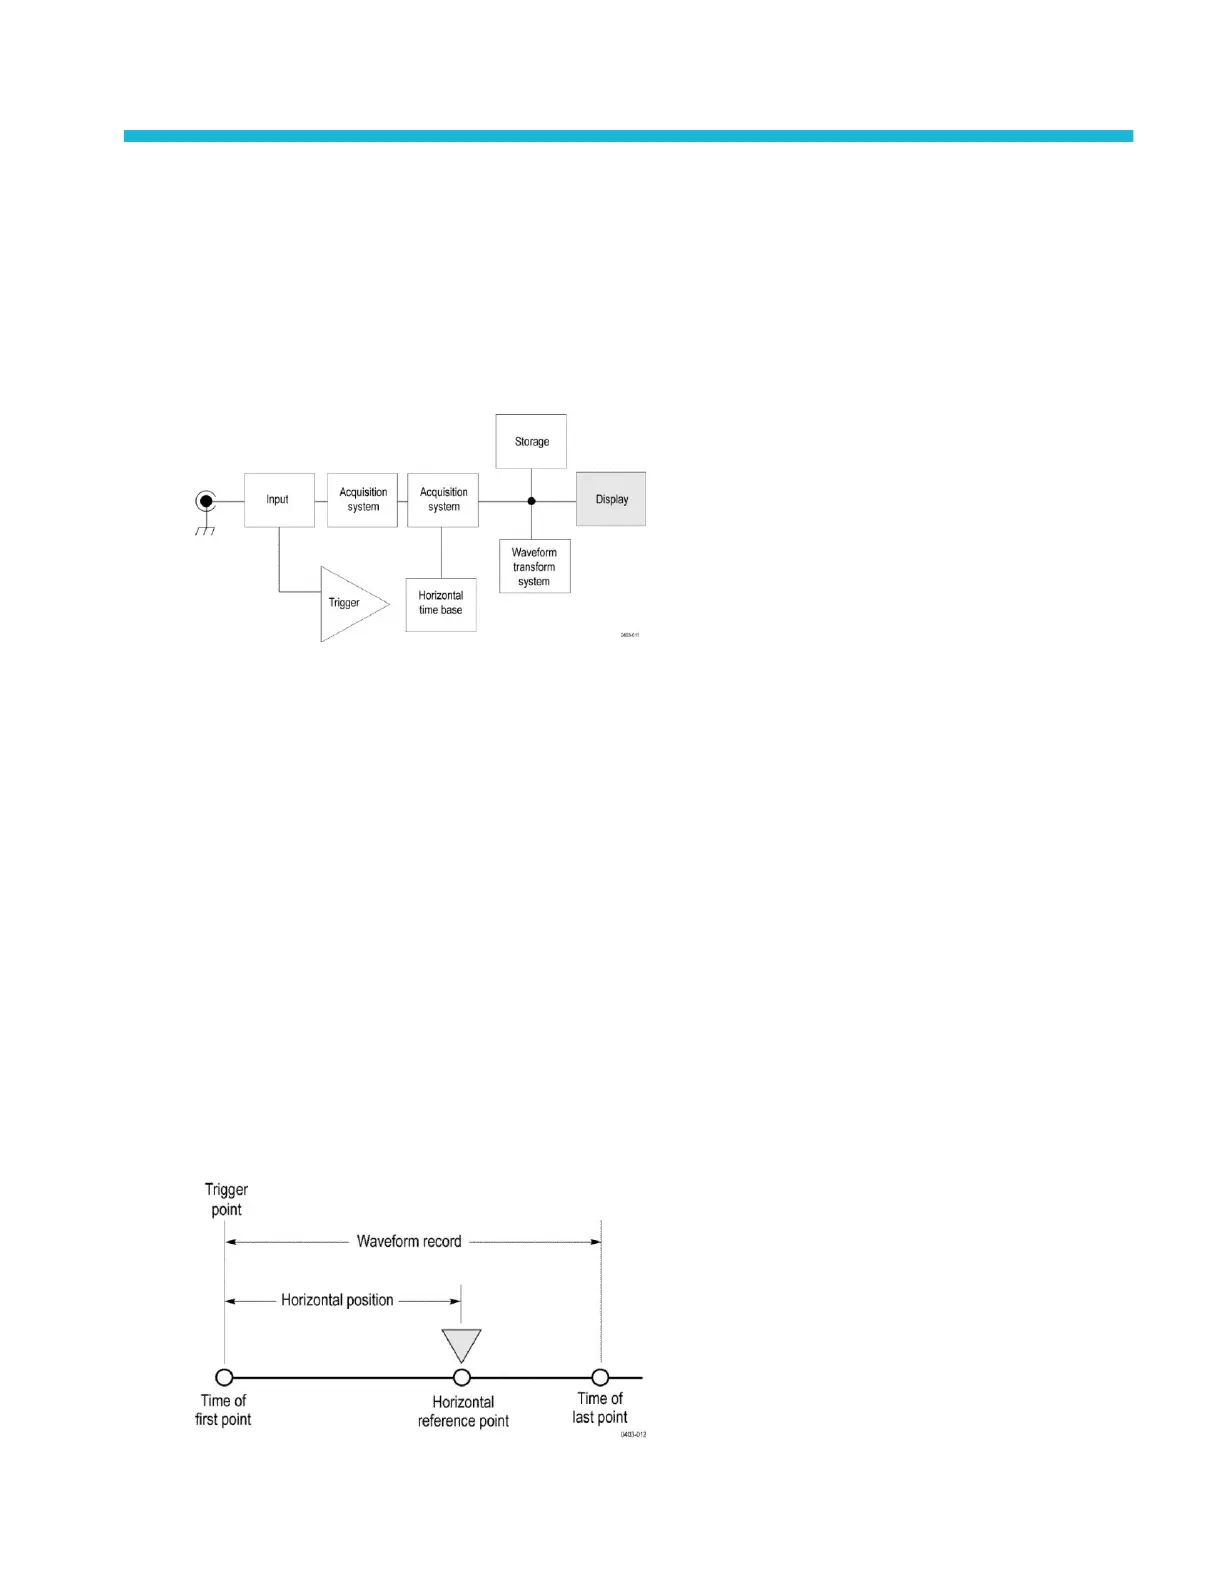
This instrument includes a flexible, customizable display that lets you control how waveforms appear. The figure shows how the
display features fit into the overall instrument operation.
The display shows analog, digital, math, reference and bus waveforms. The waveforms include channel markers, individual
waveform graticule readings, and trigger source and level indicators. You can set the display to stack each waveform vertically in
separate graticules, called 'slices' (the default mode), or overlay all the waveforms on the screen (traditional waveform view).
You can also add histogram, spectral, eye, and measurement results views (plots) for individual measurements. These plot views
are contained within their own view window and can be moved within the overall view area.
Waveform preview mode
The waveform preview attempts to show what the next acquisition will look like when the acquisition is delayed due to slow
triggers or long acquisition duration, or when the acquisitions have stopped. Waveform preview recalculates math waveforms, but
does not represent changes in trigger levels, trigger modes, or different acquisition modes.
Horizontal position and the horizontal reference point
The time value you set for horizontal position is measured from the trigger point to the horizontal reference point. This is not the
same as the time value from the trigger point to the start of the waveform record, unless you set the horizontal reference to 0%.
See the next figure.
MSO54, MSO56, MSO58, MSO58LP, MSO64 Help 427
 Loading...


