Interface and display
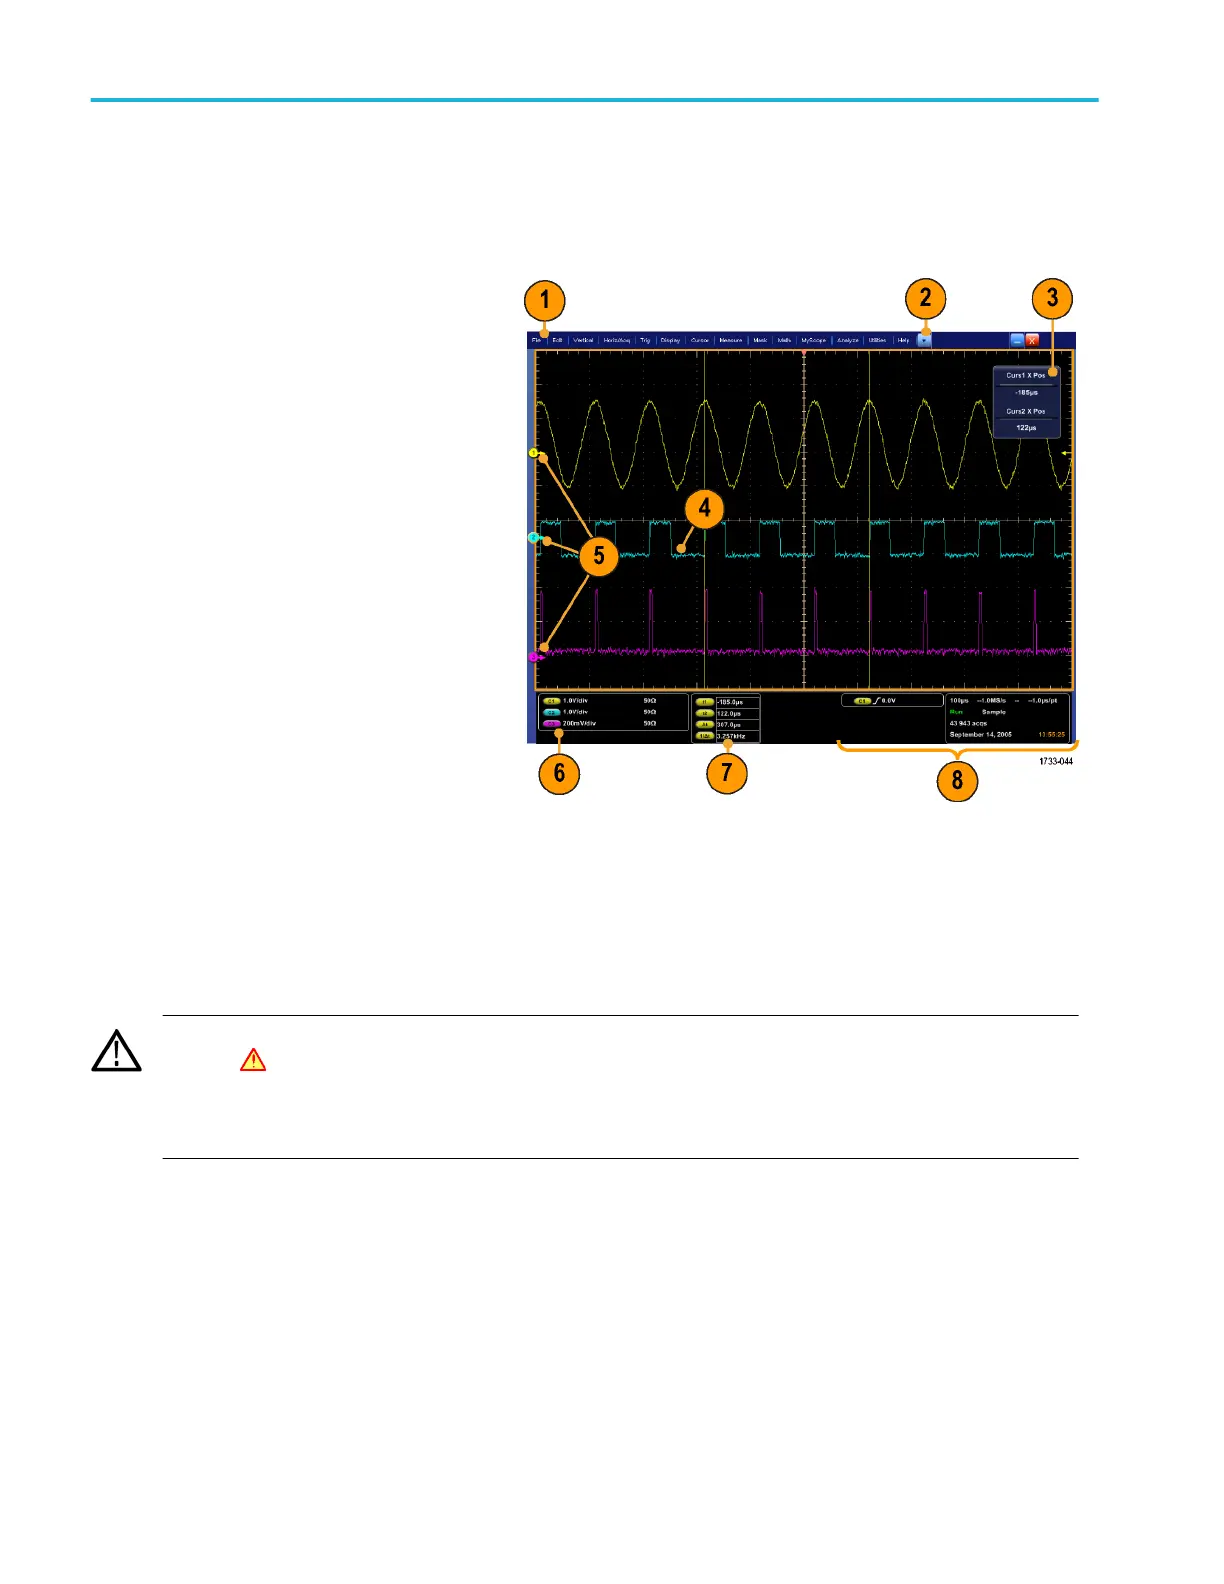
The menu bar mode provides access to commands that control all of the instrument features and functions. The toolbar mode
provides access to the most common features.
1. Menu Bar: Access to data I/O, printing,
online help, and instrument functions
2. Buttons/Menu: Click to toggle between
toolbar and menu bar modes and to
customize your toolbar
3. Multipurpose Knob Readouts: Adjust
and display parameters controlled by the
multipurpose knobs
4. Display: Live, reference, math, and bus
waveforms display here, with cursors
5. Waveform Handle: Click and drag to
change vertical position of a waveform or
bus. Click the handle and change the
position and scale using the multipurpose
knobs.
6. Controls Status: Quick reference to
vertical selections, scale, offset, and
parameters. Probe status is provided for
some probe tips.
7. Readouts: Display cursor and
measurement readouts in this area.
Measurements are selectable from the
menu bar or toolbar. If a control window
is displayed, some combinations of
readouts move to the graticule area.
WARNING. If there is vertical clipping, there may be a dangerous voltage on the probe tip, but the readout will indicate a low
voltage. A symbol appears in the measurement readout if a vertical clipping condition exists. Automatic amplitude-related
measurements where the signal is vertically clipped produce inaccurate results. Clipping also causes inaccurate amplitude
values in waveforms that are stored or exported for use in other programs. If a math waveform is clipped, it will not affect
amplitude measurements on that math waveform.
8. Status: Display of acquisition status, mode, and number of acquisitions; trigger status; date; time; and quick reference to
record length and horizontal parameters
Getting acquainted with your instrument
36 DPO70000SX Series User
 Loading...