Rockwell Automation Publication 1783-UM003G-EN-P - December 2012 89
Manage the Switch via the Device Manager Web Interface Chapter 3
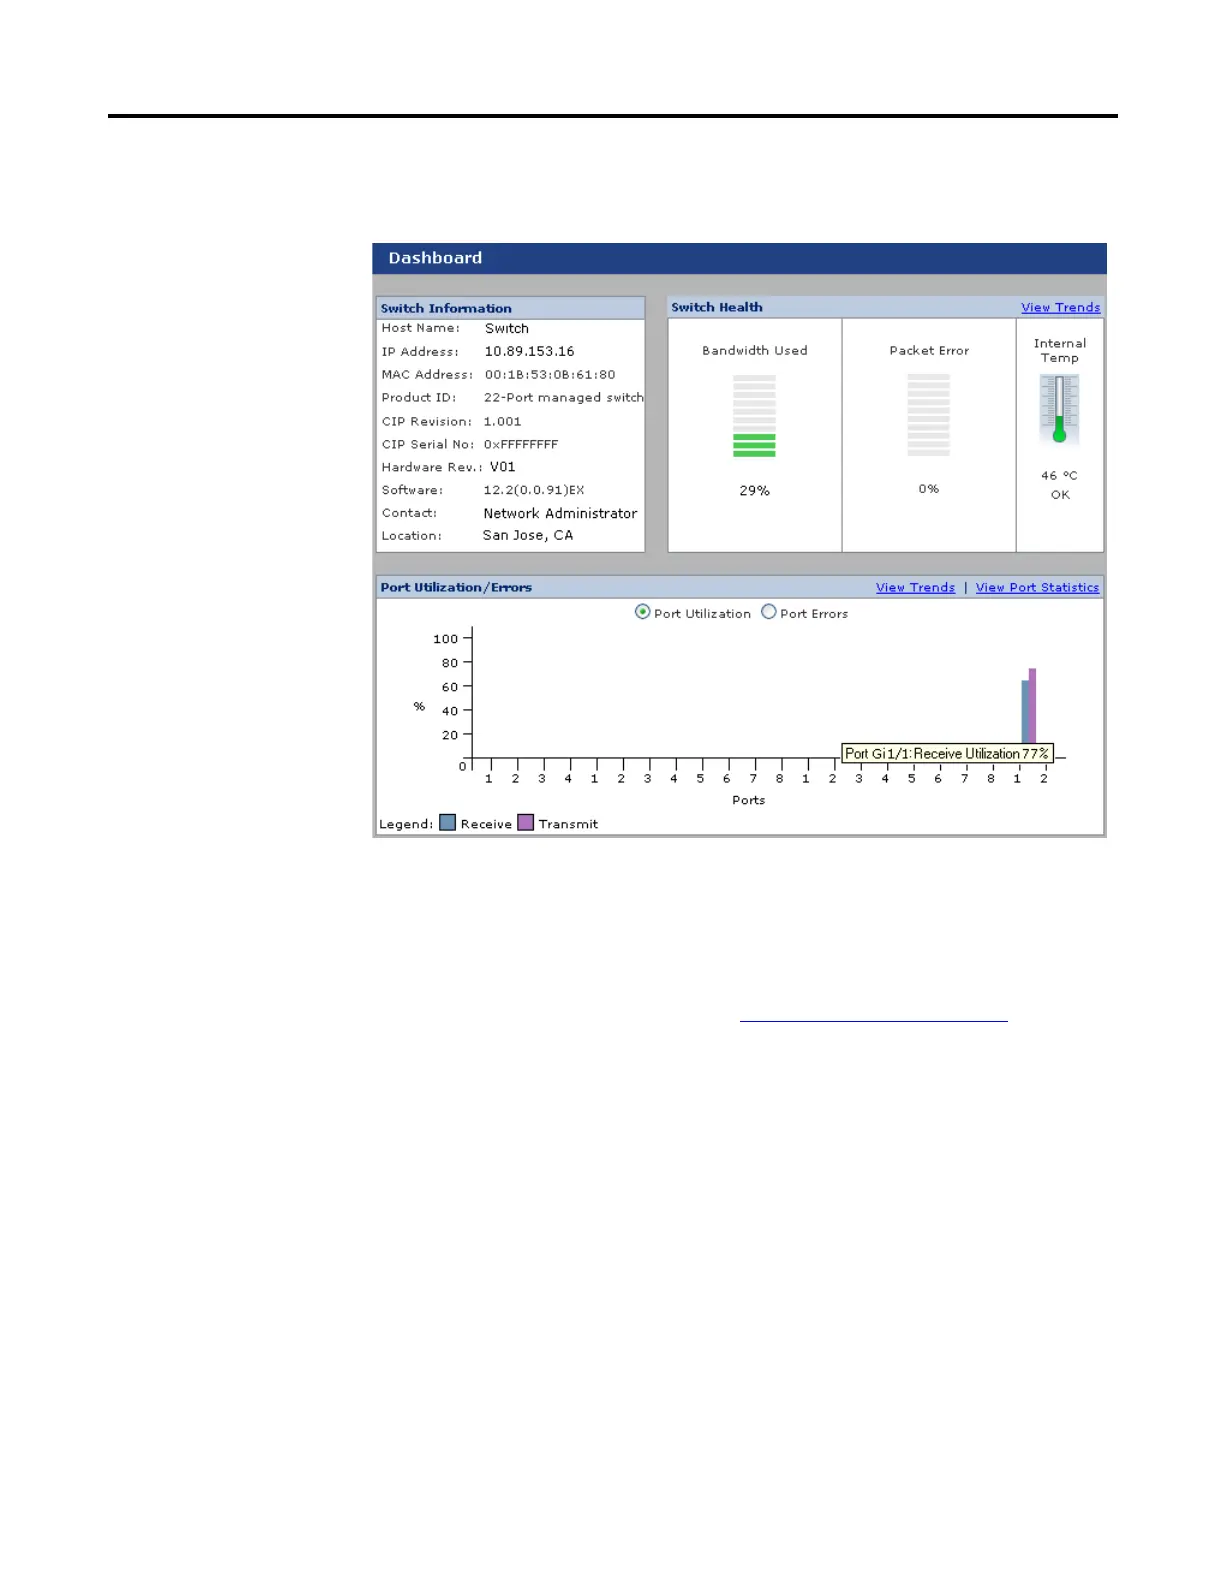
Dashboard Dialog Box
Use the dashboard to monitor switch status and performance. The dashboard is
displayed when you start the Device Manager Web interface.
The Dashboard gauges and graphs are like the graphs on the
Trends dialog box. The Dashboard displays the instantaneous
status, while the Trends graphs displays the historical status.
By using them together, you can gather the detailed conditions
of the switch and its ports. For information about the Trends
graphs, see the Trends Graphs
section on page 93.
The Front Panel view status indicators and the Status field also
provide information for monitoring the switch and its ports.
 Loading...