92 Rockwell Automation Publication 1783-UM003G-EN-P - December 2012
Chapter 3 Manage the Switch via the Device Manager Web Interface
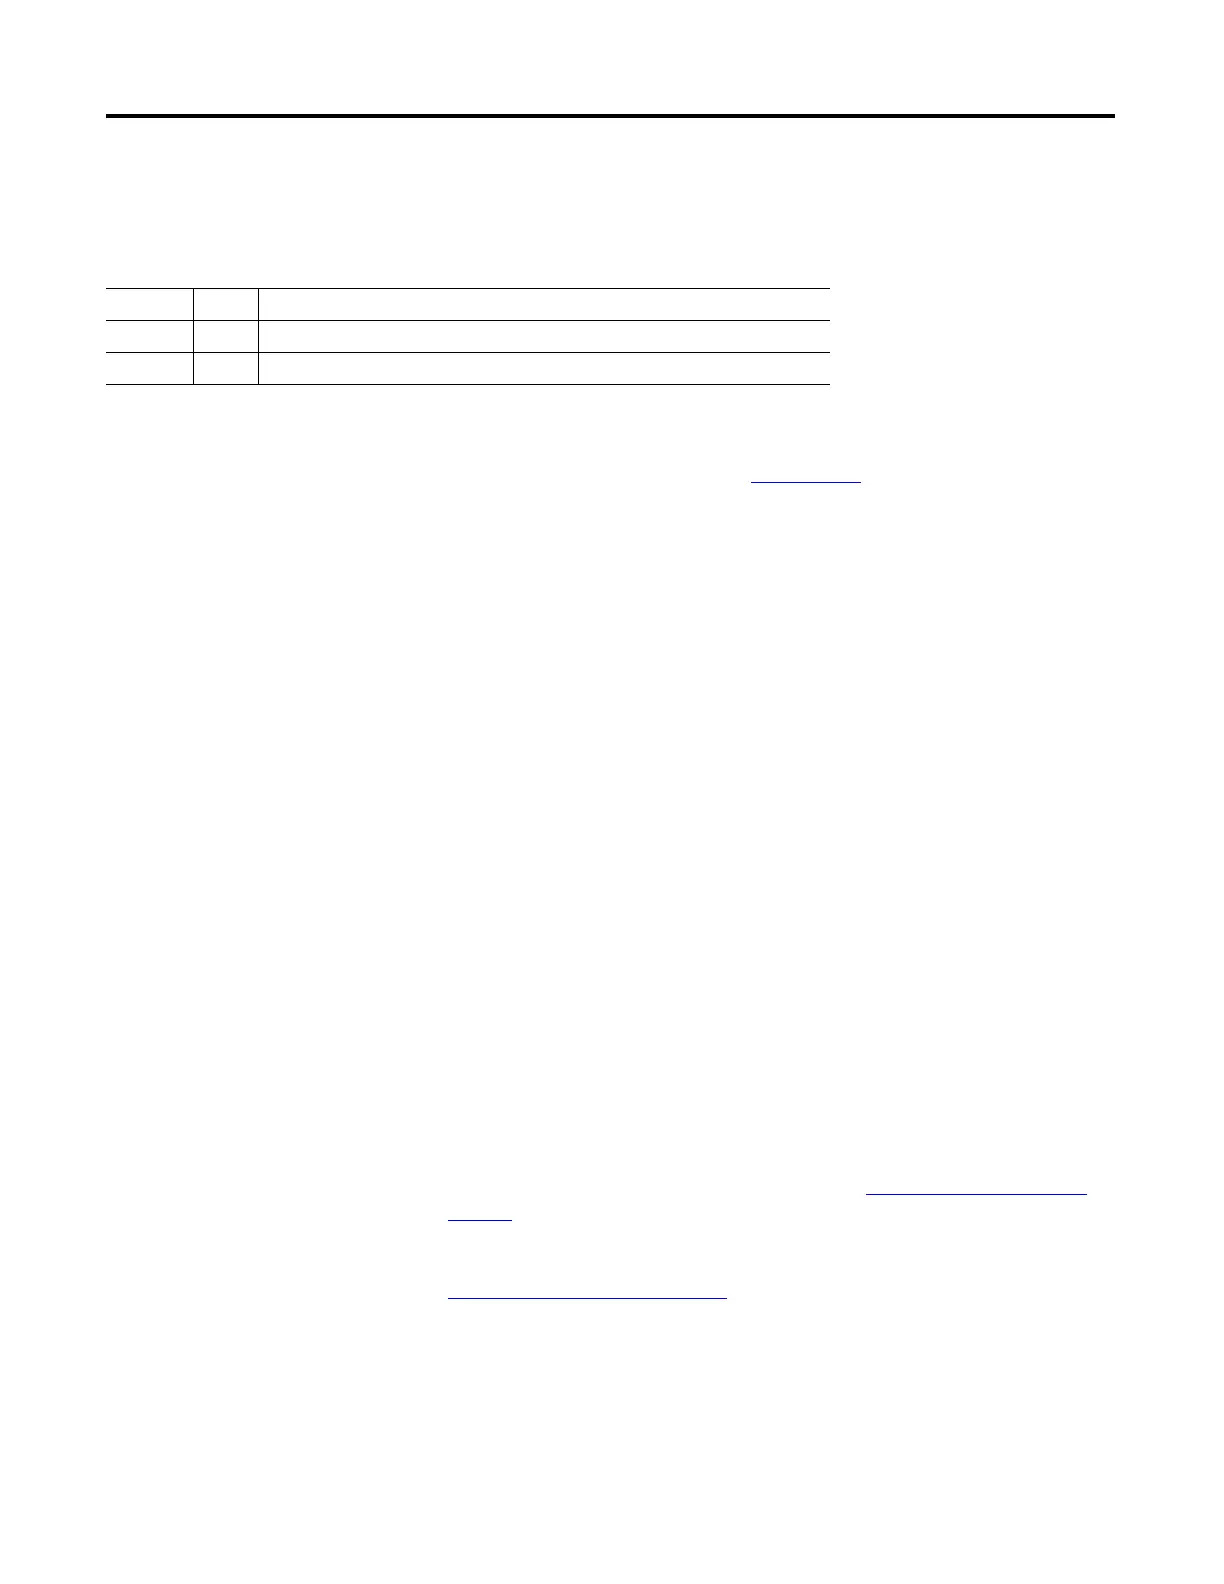
Temperature Status
The thermometer graphic displays this information.
For information about the switch temperature range and the operating
environment guidelines, see the Stratix 8000 Ethernet Managed Switches
Installation Instructions, publication 1783-IN005
.
Port Utilization and Port Errors Graphs
You can see the following information on port performance:
• Port Utilization Graph: Displays the received utilization (blue) and sent
utilization (purple) on each port.
As you monitor the usage on the ports, note whether the percentage is
what you expect during that given time of network activity. If usage is high
when you expect it to be low, a problem might exist.
Bandwidth allocation can also be based on whether the connection is
operating in Half-duplex or Full-duplex mode.
• Port Errors Graph: Displays the total percentage of errors on each port.
These are some of the reasons for errors received on or sent from the switch
ports:
– Bad cable connection
– Defective ports
– Software problems
– Driver problems
Data is collected at each 60-second system refresh. Refer to
Trends Graphs on
page 93 for a graph that shows per-port patterns over incremental instances in
time (by 60 seconds, 60 minutes, 24 hours, or 14 days).
Refer to
Port Statistics on page 96 for details on the specific port errors detected
on each port.
Indicator Status Description
OK Green Switch internal temperature is within the acceptable temperature range.
Faulty Red Switch internal temperature is above the upper temperature threshold.
 Loading...