96 Rockwell Automation Publication 1783-UM003G-EN-P - December 2012
Chapter 3 Manage the Switch via the Device Manager Web Interface
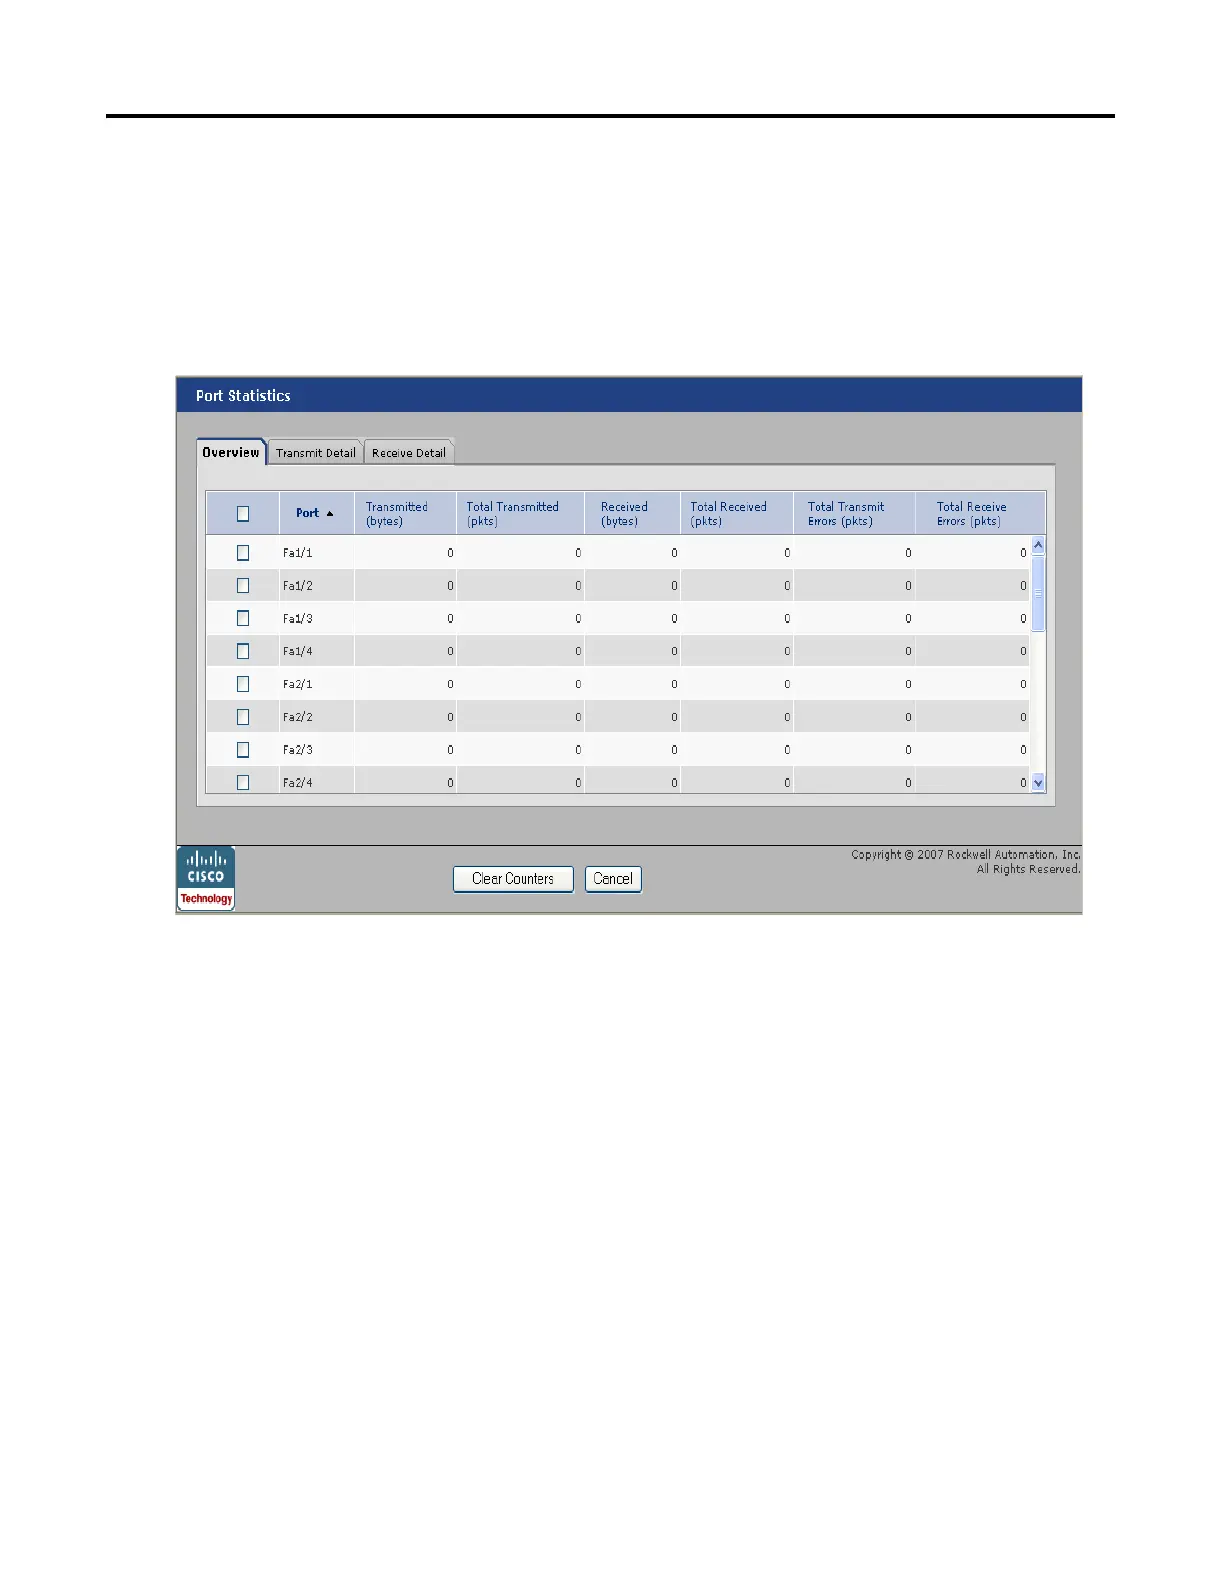
Port Statistics
The Port Statistics dialog box displays the statistics for data sent and received by
the switch ports since the switch was last powered on, was restarted, or since the
statistics were last cleared.
To display this dialog box, choose Monitor>Port Statistics from the Device
Manager Web interface. See the Device Manager Web interface online help for
additional information and procedures.
The types of port statistics collected and displayed are grouped under these tabs
on the Port Statistics dialog box on the Device Manager Web interface:
• Overview tab: Use this tab to display the specific numbers of error packets
received on and sent from the port, which is a level of detail that is not
available from the Dashboard graphs.
The number of error packets can mean a duplex mismatch,
incompatibilities with the port and its attached device, or faulty cables or
attached devices. Any of these problems can cause slow network
performance, data loss, or lack of connectivity.
• Transmit Detail tab: Use this tab to troubleshoot unusual changes in
network traffic. This tab displays these statistics:
– Unicast, multicast, and broadcast packets sent from each port
– Detailed statistics of errors sent to each port
 Loading...