4. Press [Move to Scan] to advance the table to the monitoring location.
5. Press [Start Scan].
6.
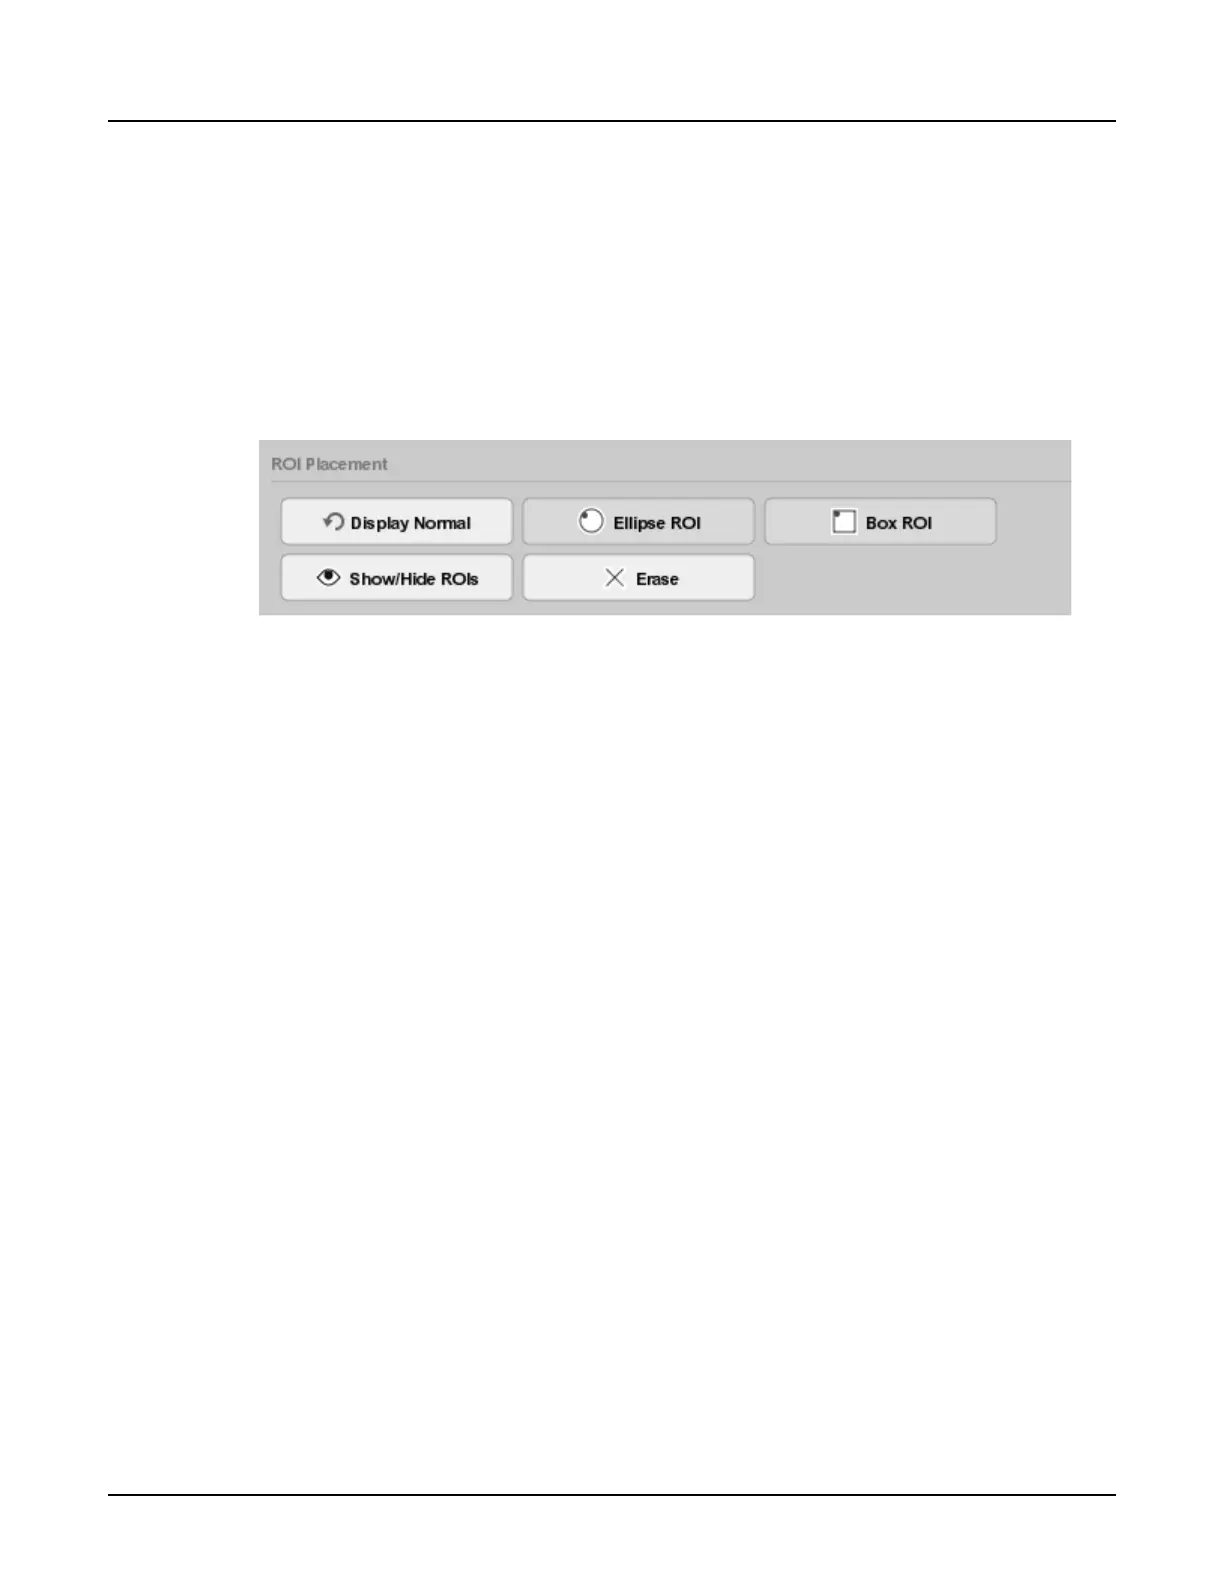
Once the scan is complete, from the reconstructed image on the display monitor, click
[Ellipse ROI] or [Box ROI] to place a maximum of three ROIs over areas of interest. Monitor
ROIs are colored blue.
For example, if scanning a liver, place an ROI in liver parenchyma away from vessels, if
evaluating a vessel place the ROI over the vessel.
Illustration 12: SmartPrep ROI placement tools
Use, as needed, the zoom, roam, display normal, hide/show graphics, erase, or explicit mag
(factor range: 0.5 to 2.0) from the SmartPrep display control panel.
7. Click [Begin Monitoring] to continue to the Monitor Phase.
3.4.2 Monitor Phase without Dynamic Transition
The Monitor phase acquires images at the monitoring location during the delivery of intravenous
iodinated contrast material and graphically displays the images, charts the enhancement
thresholds, and clock with the time since monitoring began. Use the contrast graph, contrast
table, and/or monitor images to determine when the diagnostic scan can begin.
1.
After the Baseline scan settings are confirmed, the [Start Scan] button begins to flash.
2. Simultaneously press [Start Scan] and start the IV contrast injection. A maximum of 40
monitoring scans is available. Move To Scan is typically not required since the last scan was
at the baseline location.
NOTE: If using an integrated injector, the step to start the IV contrast injection is not
needed as the command will be sent by the scanner to the injector to start the
injection.
3. The system waits the time set in the
Monitoring Delay
area, then begins acquiring images at
the time set for the interscan delay (ISD). The total SmartPrep monitor scan time shows next
to the elapsed timer. The ISD countdown displays on the
Real Time Information
area at the
bottom of the
Monitor Phase
window.
4.
Using the tools on the Monitor Phase window (refer to Section 2.3 Monitor Phase window) to
determine when the contrast has reached a sufficient level to take the diagnostic scan.
When this occurs, use the [Begin Scan Now] button to transition to the Scan Phase (refer to
Section 6.
Revolution CT User Manual
Direction 5480385-1EN, Revision 1
Chapter 12 Scan Applications 323