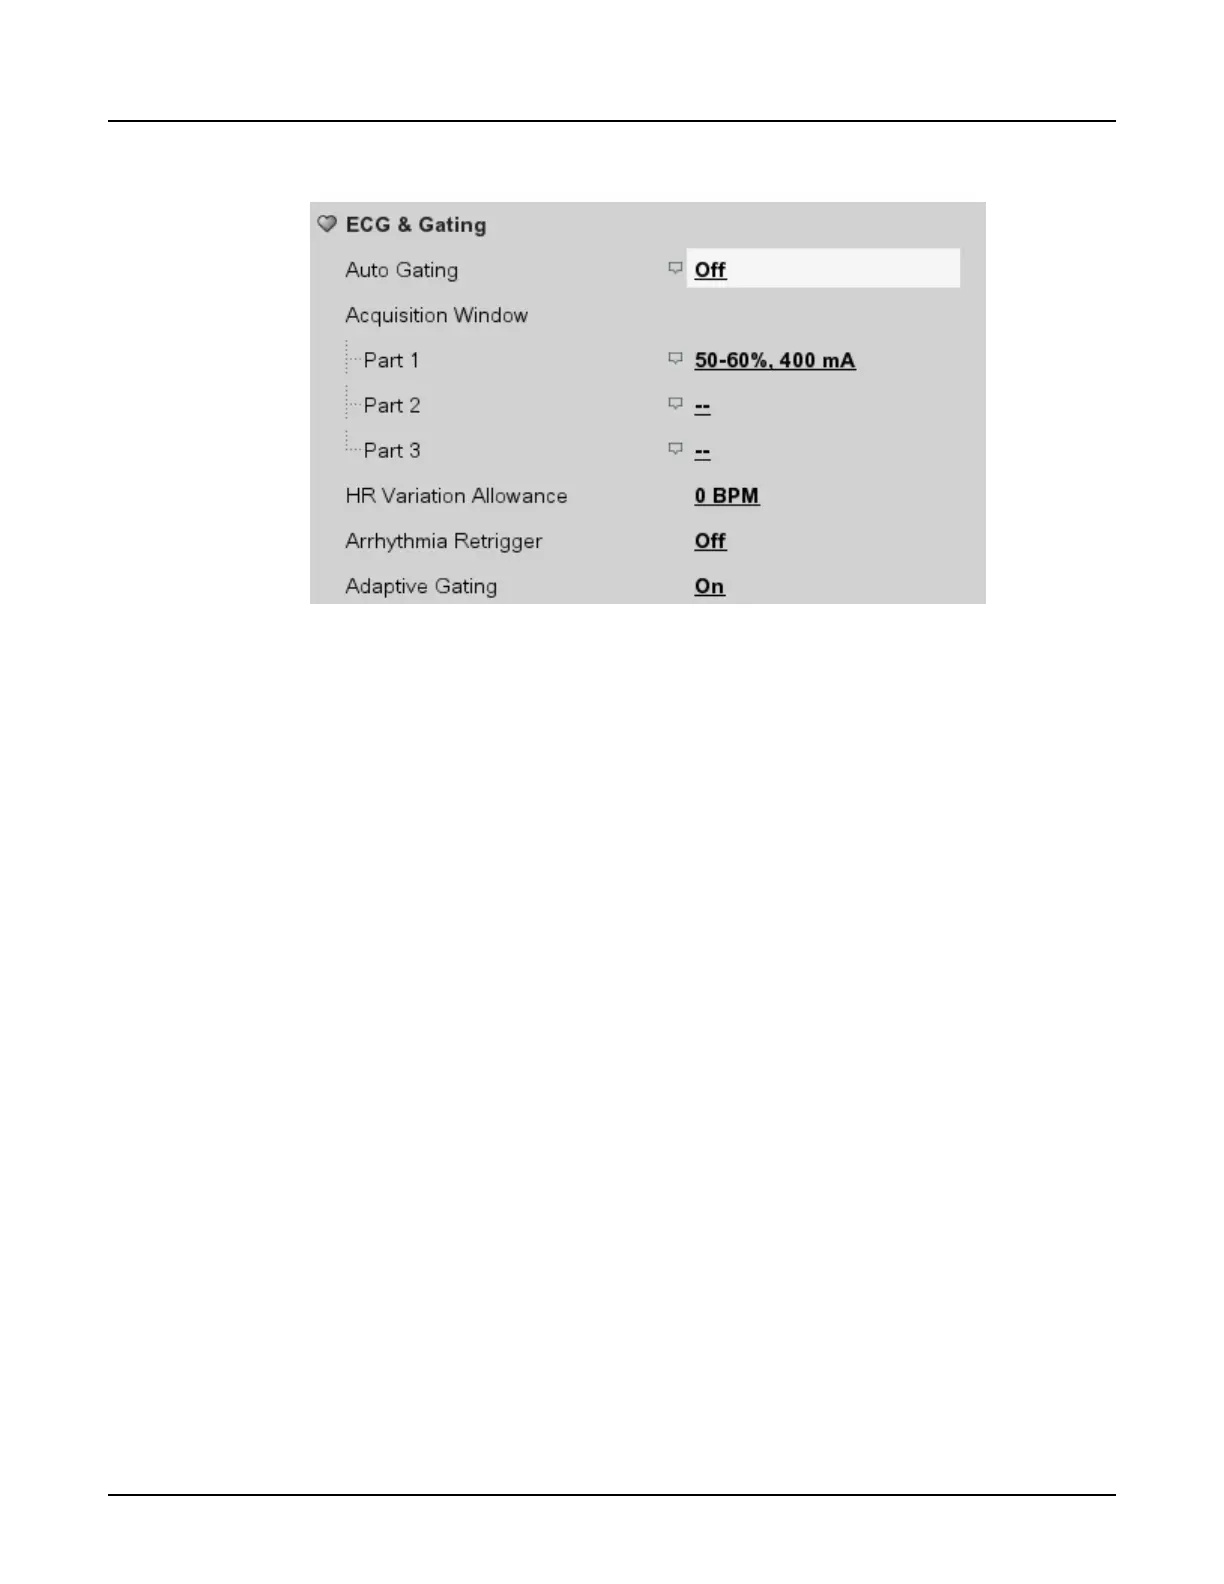
Illustration 10: ECG and Gating collection
•
The heart icon on the gantry display indicates that the internal monitor is connected to the
gantry.
•
The instantaneous BPM heart rate is shown on the user console and gantry display.
•
If the heart rate does not display and a lead off message is displayed, follow these
guidelines:
○
Check Gating box to view the ECG trace on the scan monitor.
○
Check electrode placement. Consider an alternative placement to improve the cardiac
signal.
3.5.1 Auto Gating
When Auto Gating is enabled, the system uses the heart rate measurements from the most
recent breath hold recording with the Auto Gating Profile table, to automatically prescribe the
data acquisition timing. The ECG recording that is used for Auto Gating is indicated by a white
dot next to the name of the recording, to the immediate right of the ECG trace window. Similar
white dots are next to the settings that are specified by the Auto Gating feature.
•
Turn Auto Gating “Off” to allow manual changes to any of the settings that are specified by
the Auto Gating feature.
•
Turn Auto Gating “On” to reapply the settings determined by the heart rate measurements
and the Auto Gating Profile, removing any manual changes that may have been made to a
setting.
The Acquisition Window Parts, described below, set the desired areas of the cardiac cycle to be
imaged and thus determine the overall exposure time of the scan(s). The
kV and mA Control
settings determine the mA values as a function of the heart cycle and thus determine the dose
of the scan(s).
Revolution CT User Manual
Direction 5480385-1EN, Revision 1
348 3 Cardiac Scan Parameters
 Loading...