COMMISSIONING
Part No.: 4417340 Revision 1 Service Manual 245
954 SmartServo FlexLine
The same procedure must be followed for all different levels, with for
instance an interval of 1 meter. Then the following table is obtained:
Example of hydrostatic deformation figures
Level
[m]
Deformation
[mm]
Level
[m]
Deformation
[mm]
Level
[m]
Deformation
[mm]
0 0 8 0.54 16 2.64
1 0.01 9 0.69 17 3.08
2 0.03 10 0.88 18 3.57
3 0.07 11 1.09 19 4.17
4 0.13 12 1.32 20 4.71
5 0.20 13 1.59 21 5.36
6 0.29 14 1.90 21.945 6.04
7 0.40 15 2.25
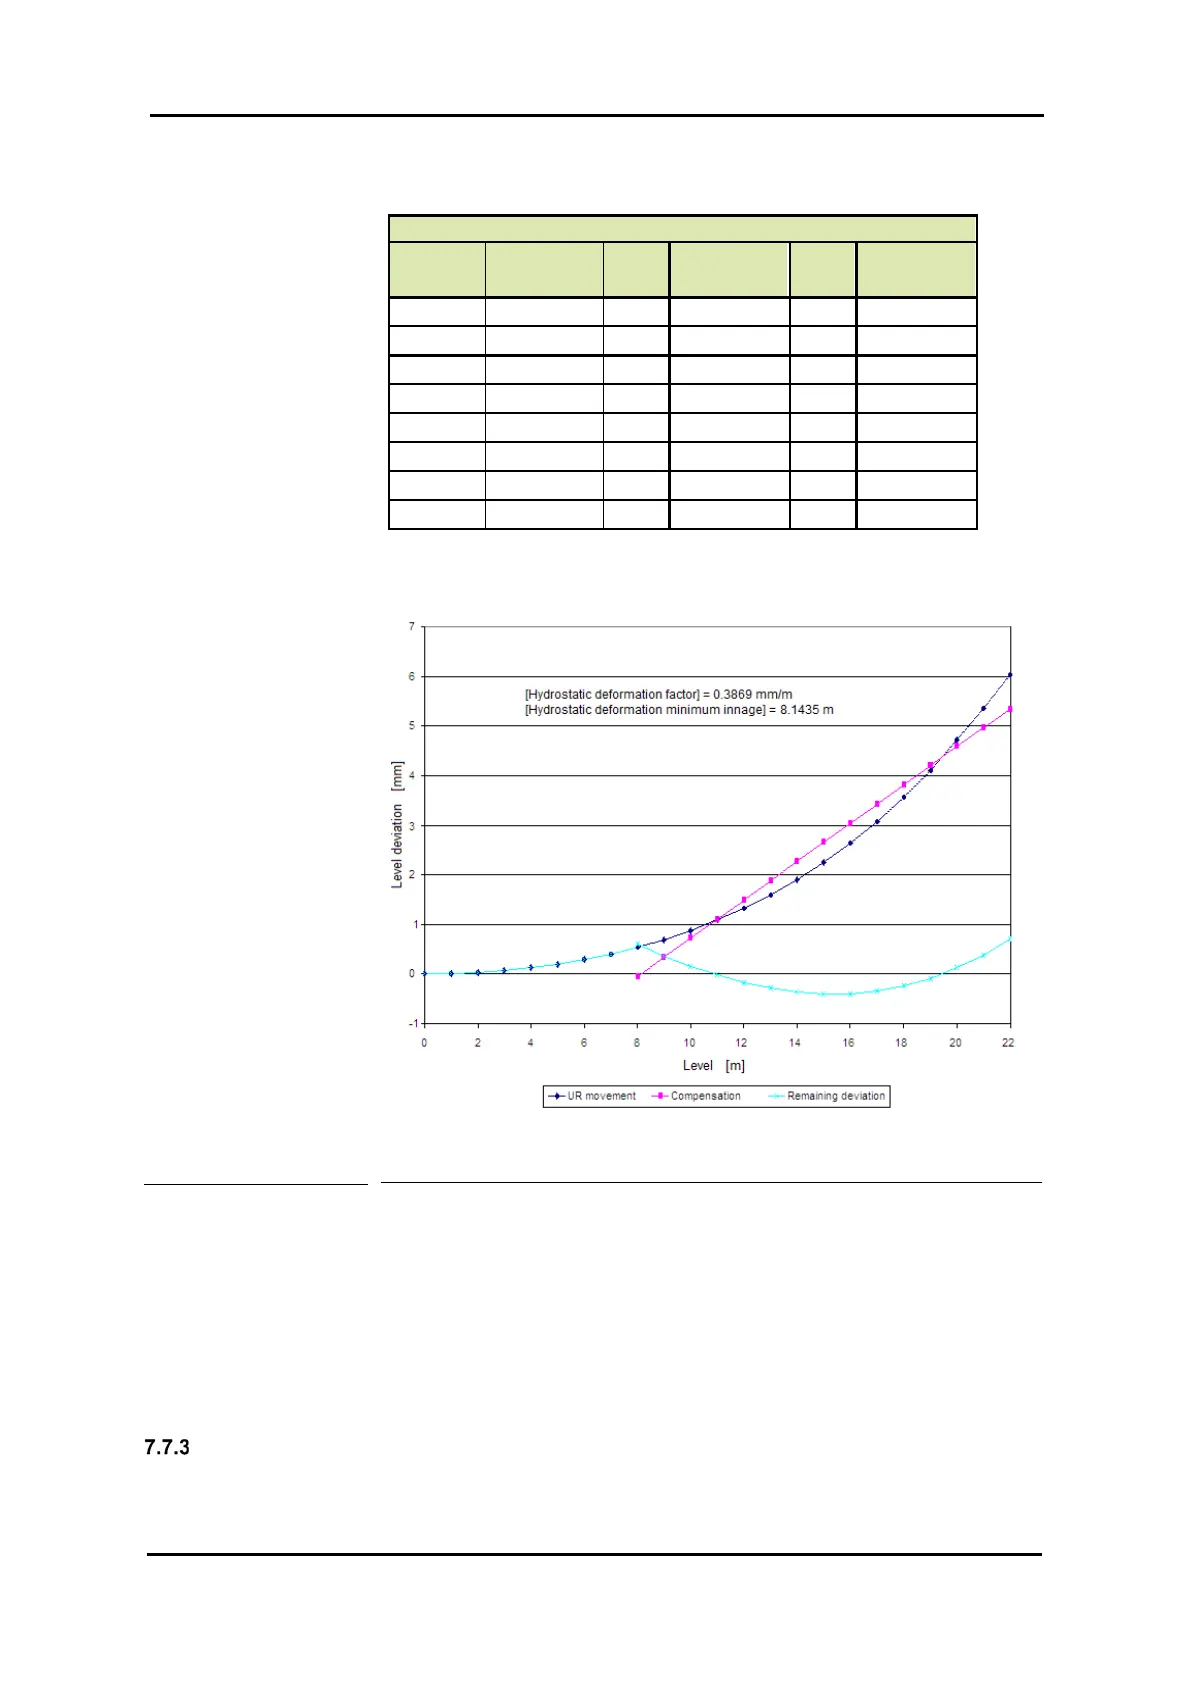
The values in this table are the basis for the graph in Figure 7-43
Figure 7-43 Example of hydrostatic deformation correction
Calculate a regression line from the level where the tank shell
deviation is approximately 0.5 mm. In this example, the regression line
is calculated from 8 meters level till the maximum level.
Then, the [Hydrostatic deformation factor] becomes: 0.3869 mm/m.
The [Hydrostatic deformation level] is the point where the regression
line crosses the X-axis; in this example at 8.1435 m.
Protection and detection settings
For proper functioning the servo gauge has several protection
mechanisms implemented. For normal operation these protection
 Loading...