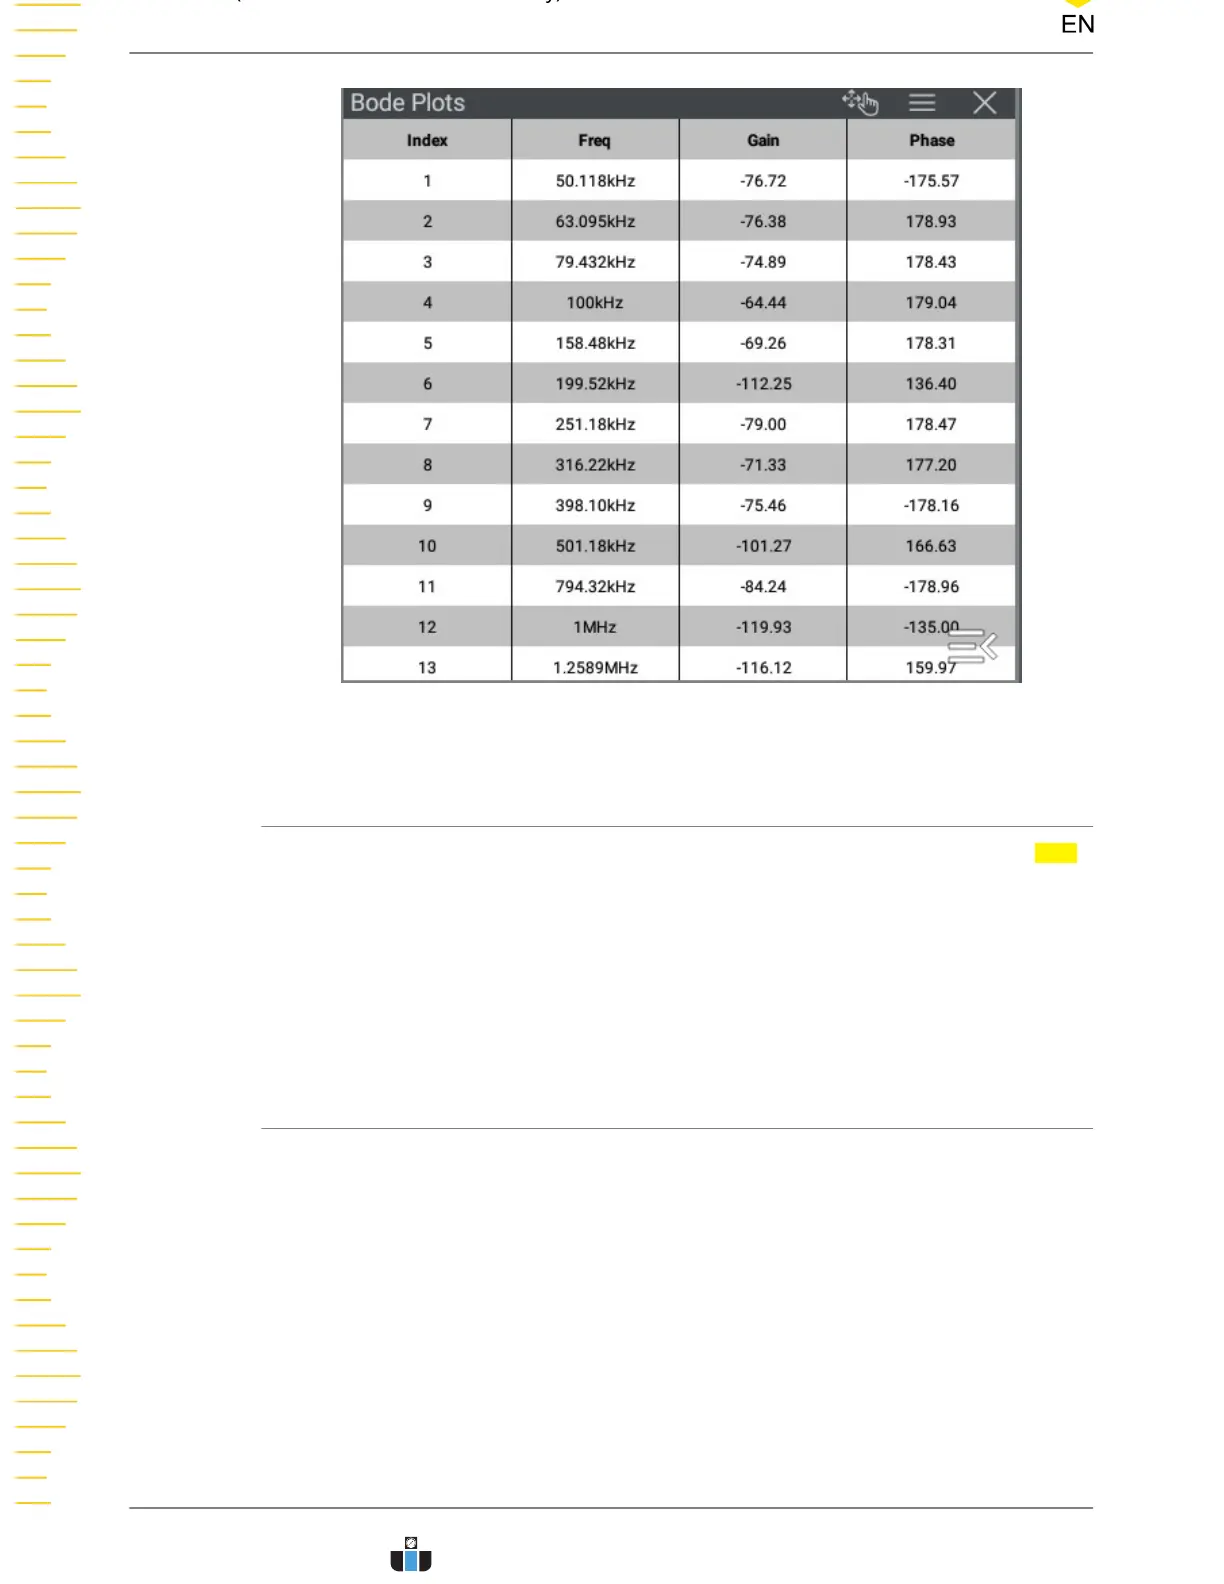
Figure 15.4 Bode Plot Chart Display
15.1.8 Connection Diagram
Before enabling the Bode function, make a proper loop connection. Click or tap Tips
to view the circuit connection diagram in the pop-up window. See the connection
diagram. Connect the rear-panel [AFG OUT] interface to the isolation transformer.
Inject the output signal of the isolation transformer to the injection resistor of the
circuit under test. Then measure the signals at the injection point and the output
point.
15.2 Cursor
The cursor is displayed as a white vertical line (as shown in
Figure 15.3
) in the bode
plot. Its X-axis value (Freq), Y-axis value of the crossover point between the cursor
and the magnitude-frequency curve (Gain), Y-axis value of the crossover point
between the cursor, and the phase-frequency curve (Phase) are displayed at the
upper-left corner of the interface. You can rotate the multipurpose knob 1 to adjust
the cursor position to view the information of each point.
Bode Plot (for DHO914S and DHO924S only)
DHO900 User Guide
182
Copyright ©RIGOL TECHNOLOGIES CO., LTD. All rights reserved.
www.calcert.com sales@calcert.com1.888.610.7664
0
5
10
15
20
25
30
 Loading...