Advanced cardiac measurements and analysis
Vivid S70 / S60 – User Manual 8-13
BC092760-1EN 01
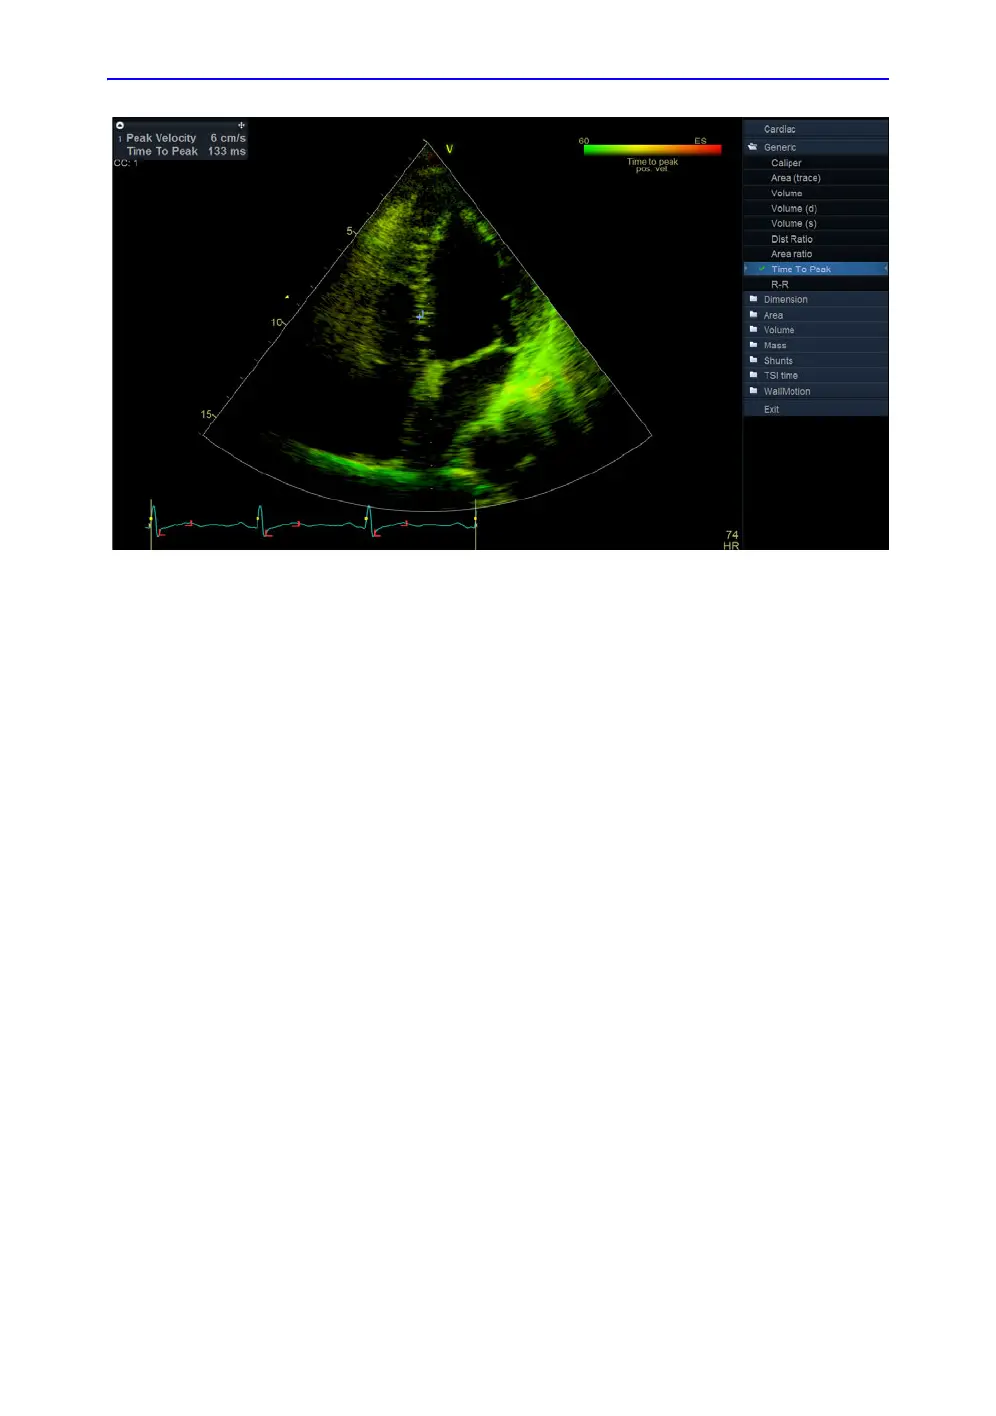
Figure 8-5. TSI Generic Time to peak measurement screen
Segment Time to peak measurements
1. Acquire TSI loops from all three apical views.
2. Press Measure and select the TSI time study.
The TSI loop freezes at the TSI end frame.
The first measurement in the study is automatically selected
(see Figure 8-6).
3. Place a point in the middle of the corresponding segment in
the TSI image.
The Time to peak value for the segment is displayed in the
Measurement result window.
4. Perform a measurement for all basal and mid-level
segments in all three apical views.
In addition to the Time to peak value for each segment, the
following TSI indexes are calculated:
• Septal lateral delay: difference in Time to peak velocity
in the basal lateral wall and basal septum.
• Septal posterior delay: difference in Time to peak
velocity in the basal posterior wall and the basal
antero-septum.
• Basal seg. max diff.: difference between the maximum
and minimum time to peak measurements in the six
basal segments. Requires at least four of the six basal
segment measurements.

 Loading...