Measurements and Analysis
8-14 Vivid S70 / S60 – User Manual
BC092760-1EN
01
• Basal standard deviation: the standard deviation of the
time to peak measurements in the six basal segments.
Requires at least four of the six basal segment
measurements.
• All seg. max diff.: difference between the maximum and
minimum time to peak measurements in all the
measured basal and mid level segments. Requires at
least eight of the twelve segmental measurements.
• All segments standard deviation: the standard deviation
of the time to peak measurements in all measured basal
and mid level segments. Requires at least eight of the
twelve segmental measurements.
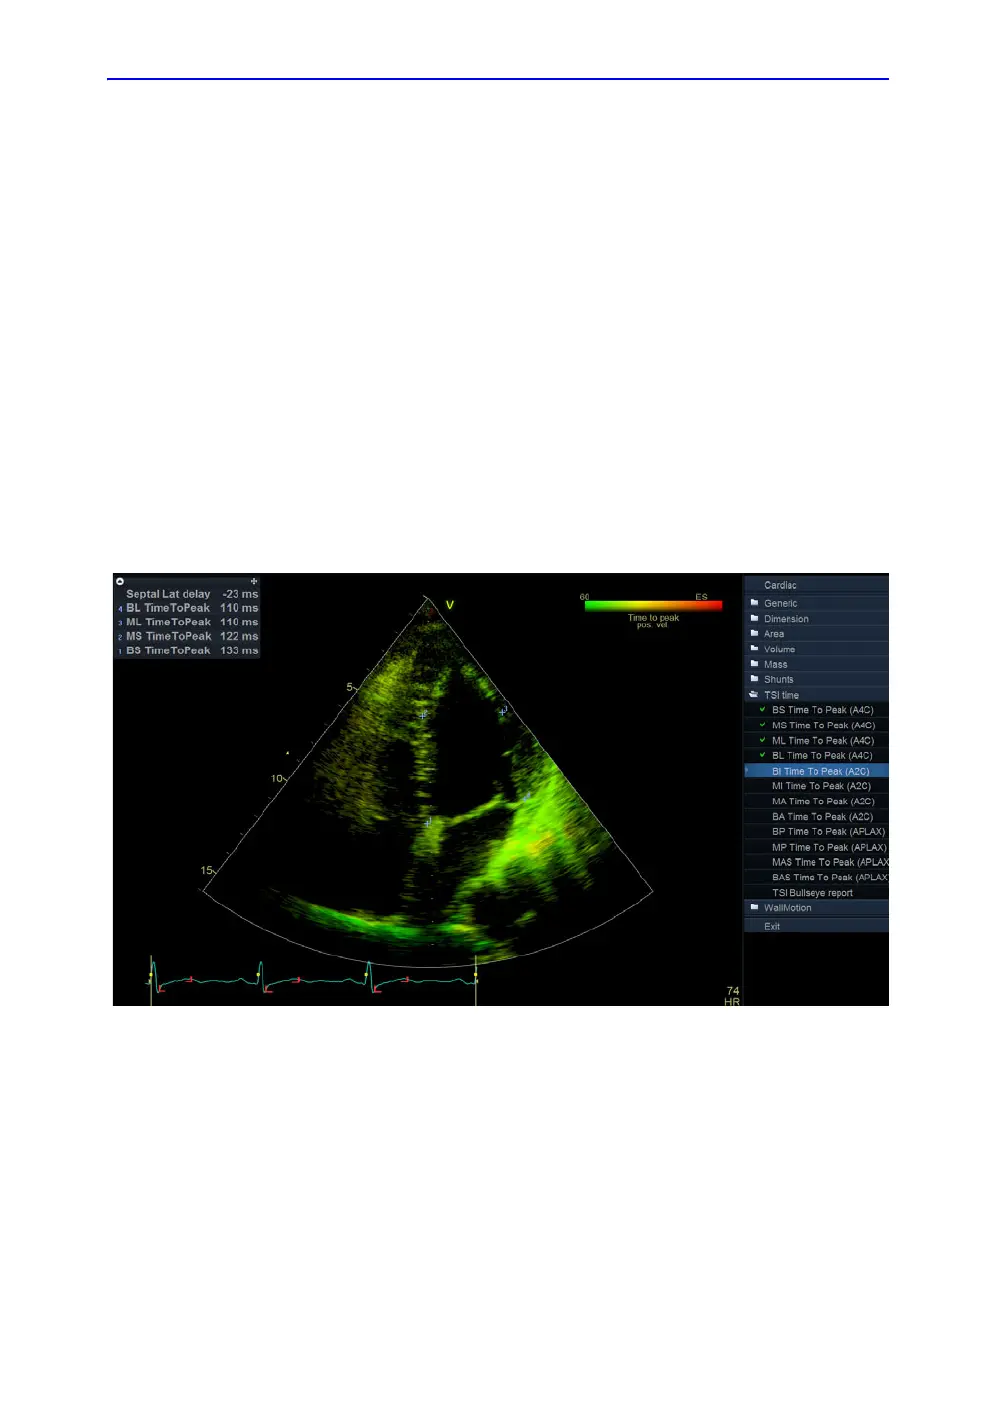
The TSI indexes indicate degrees of asynchrony in time to
peak velocity.
5. Select TSI Bull’s eye report in the Measurement menu.
The measurements are displayed in a color coded bull’s eye
diagram together with a list of the calculated TSI indexes.
Figure 8-6. Segment Time to peak measurements screen
TSI trace
The TSI Time to peak measurement can be verified and
eventually manually changed from the TSI trace.
1. Double click on the measurement point.
The ROI and the corresponding TSI curve are displayed
(see Figure 8-7).

 Loading...