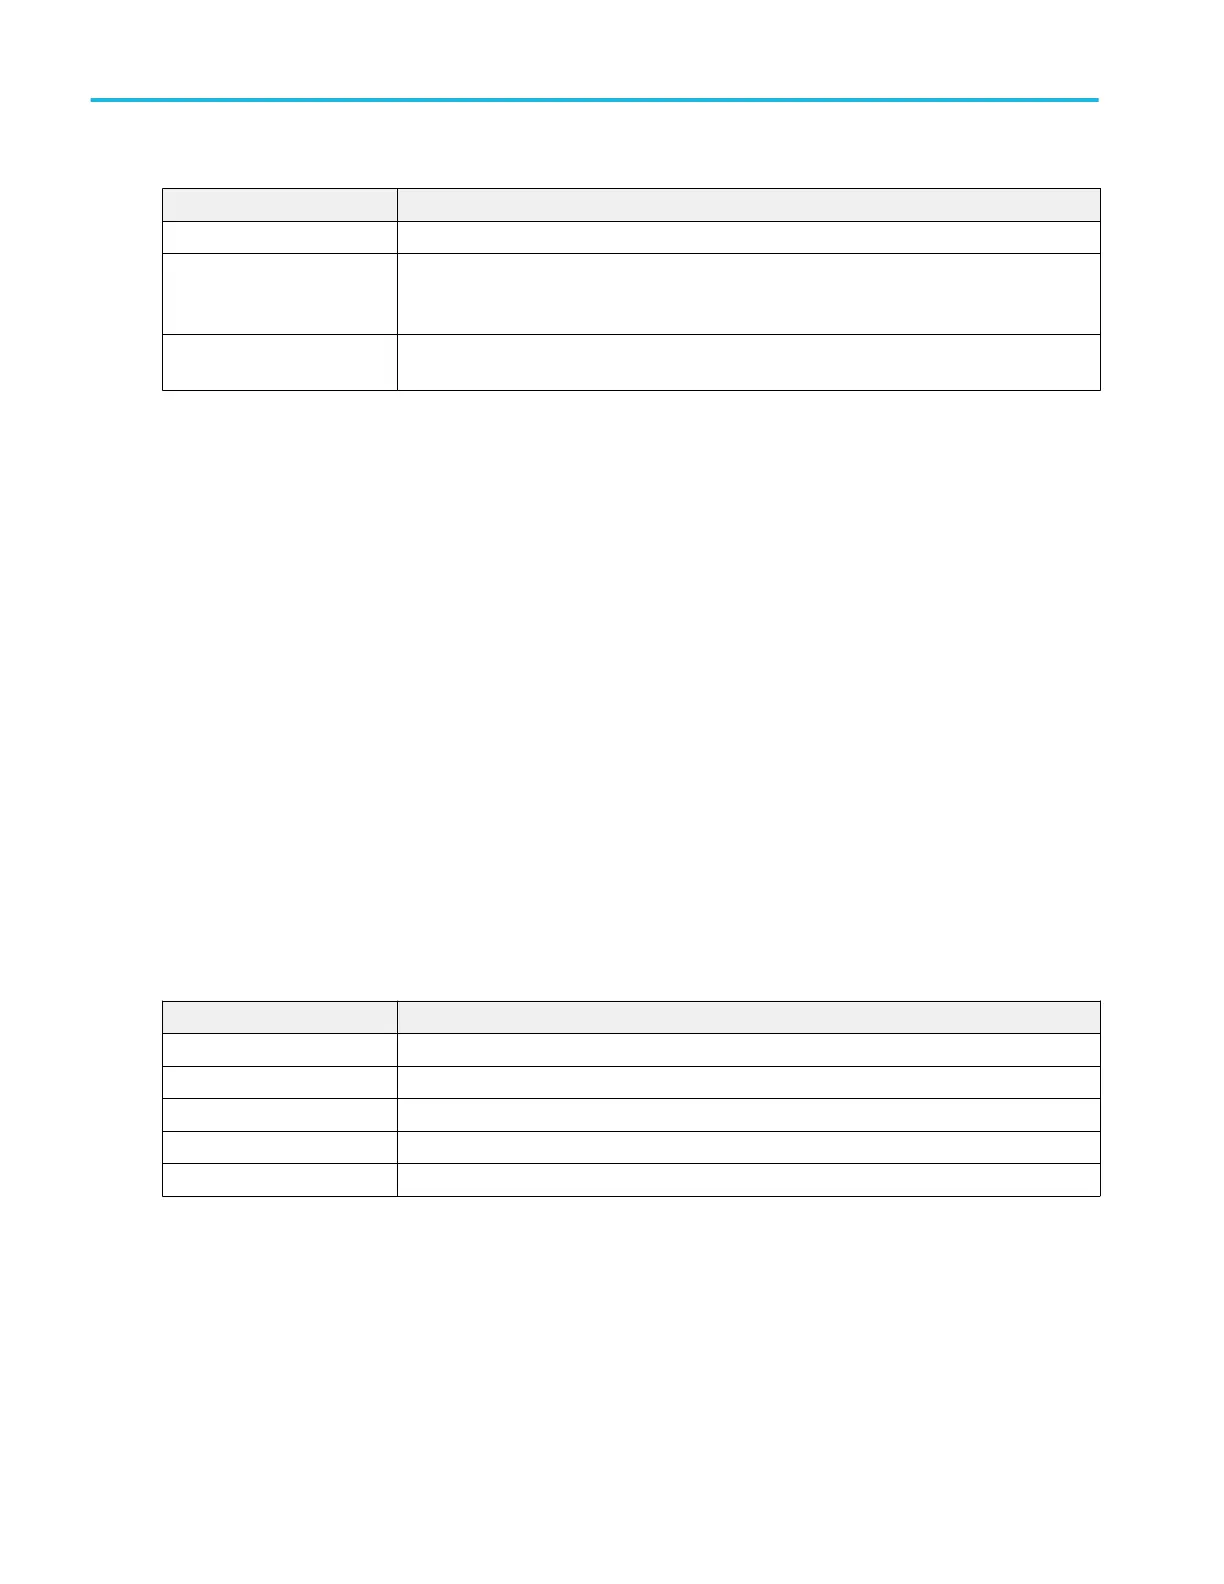
Add Plot menu fields and controls
Field or control Description
Sources Sets the input sources for the plot. The number of source fields listed depends on the plot.
XY, XYZ, Eye Diagram Select the plot type to add to the screen.
Eye Diagram adds a TIE measurement badge to the Results bar and adds the eye diagram to
the screen.
Add Adds the selected plot to the screen. You can also double tap on a plot type to add it to the
screen.
Configuring plots
Each plot has a menu that lets you configure that plot's settings. See Plot configuration menus on page 317.
Closing a plot view
To close (delete) a Plot view, tap the X in the upper right corner of the view.
Deleting the Measurement badge that enabled the plot also closes the plot.
Add Results Table configuration menu
Use this configuration menu to add a table of all active measurements, searches, or bus decode values. Results tables show
values in a spreadsheet-like format.
To open the Add Results Table configuration menu, tap the Add New... Results Table button.
To add a result table to the screen:
1. Tap Add New... Results Table.
2. Select a table type.
3. Tap Add. You can also double-tap a table type to add it to the screen.
Add Results Table menu fields and controls
Field or control Description
Measurements Display a table of all the measurements in the Results bar.
Search Display a table of all defined searches with each search shown on its own tab.
Bus Decode Display a table of the bus decode results.
Harmonics Displays a table of the Harmonics measurement results (optional).
Add Displays the selected table type. You can add as many tables as you want on the screen.
Menus and dialog boxes
220 MSO54, MSO56, MSO58, MSO58LP, MSO64 Help
 Loading...


