Closing a plot view.
To close (delete) a Plot view, tap the X in the upper right corner of the view.
Deleting the Measurement badge that enabled the plot also closes the plot.
Bathtub plot configuration menu
Use this menu to change settings of a displayed jitter versus BER (bathtub) plot.
To open the Bathtub plot configuration menu, double-tap anywhere in the Bathtub plot view.
To close a plot view, tap the X in the upper right corner of the view. Deleting the Measurement badge that opened the plot also
closes the plot.
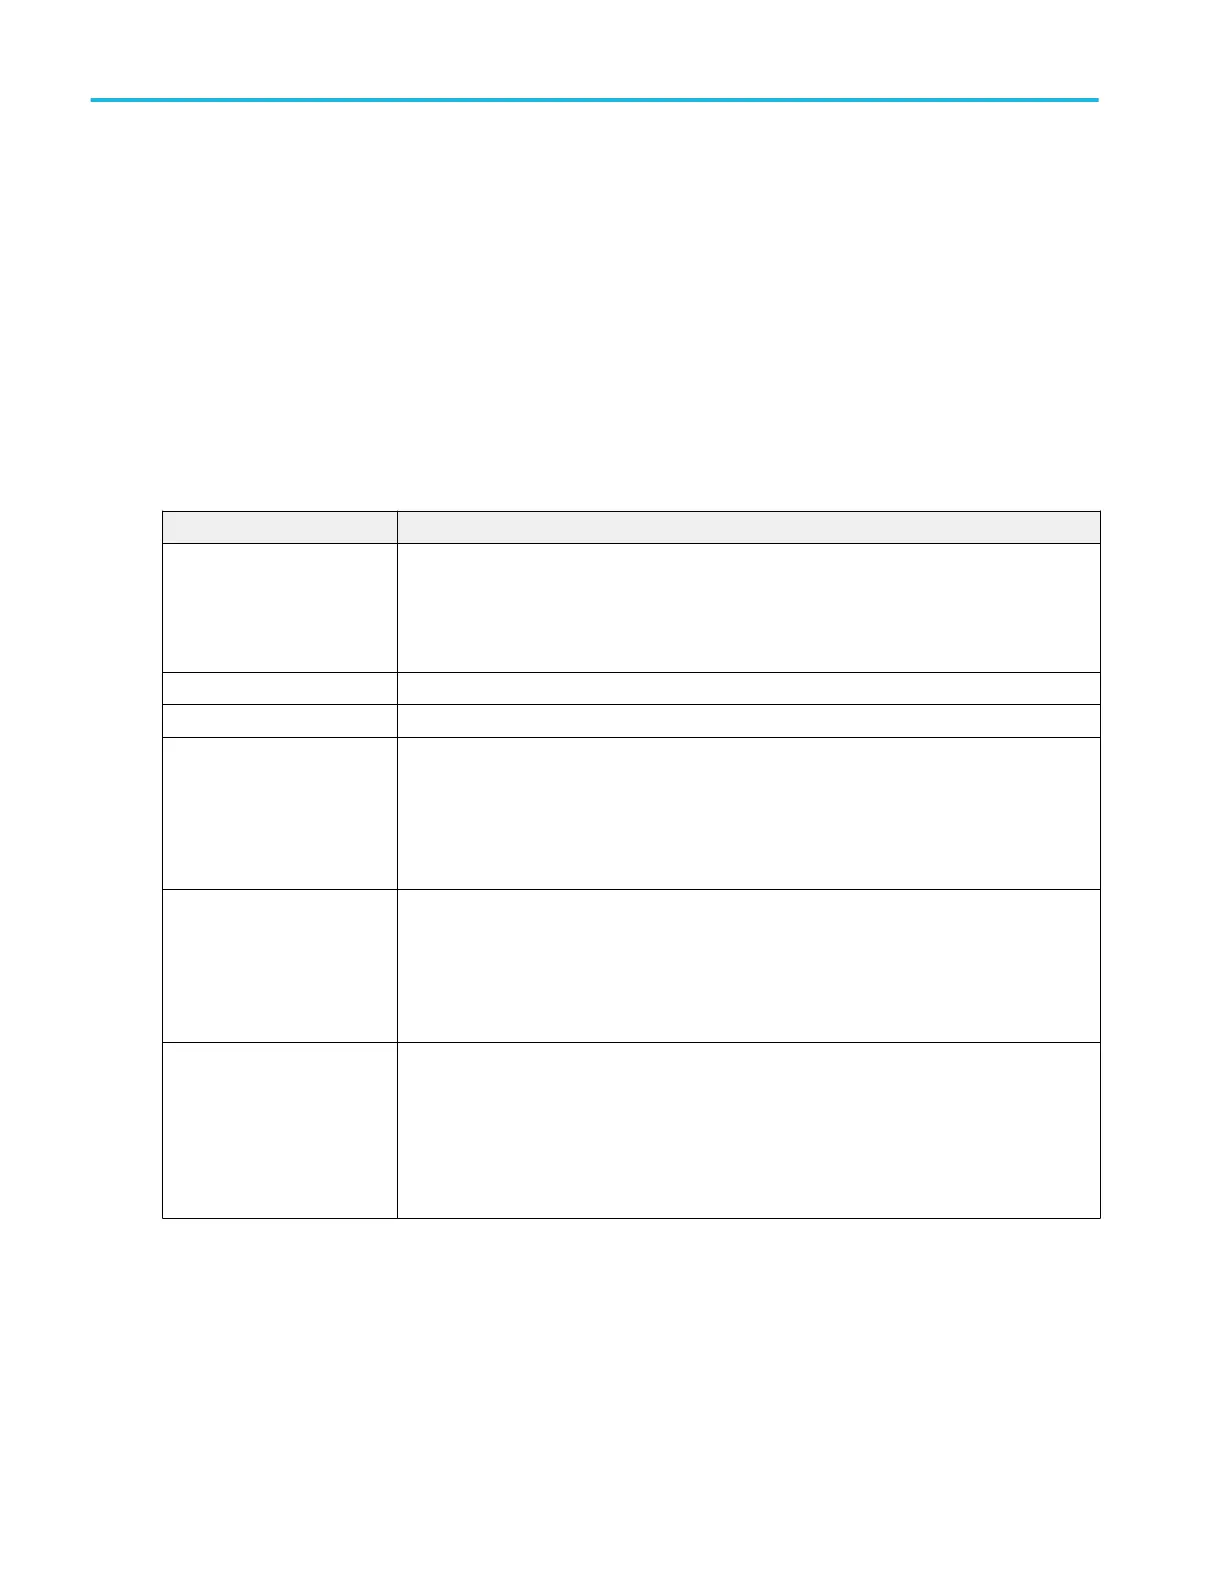
Settings panel (Bathtub plot configuration menu) fields and controls.
Field or control Description
Autoscale Toggles auto scaling of the plot on or off.
When AutoScale is off, a small Zoom window appears in the plot. Drag the blue zoom area box
in the small Zoom window to view that area in the main Plot view. Use the Zoom and Pan front-
panel knobs to change the zoom area and horizontal position.
Gridlines Sets which gridlines to show in the plot. Available gridlines are Horizontal, Vertical, and Both.
X-Axis Units Sets the X-axis units to be unit intervals or seconds.
X-Axis From, To Sets the beginning and end scale range to display in the plot for the X-Axis scales, in unit
intervals.
These values also define the horizontal area shown in the small Zoom window.
Available when AutoScale is off.
Y-Axis From, To Sets the beginning and end scale range to display in the plot for the Y-Axis scales, in BER
units.
These values also define the vertical area shown in the small Zoom window.
Available when AutoScale is off.
Y-Axis scale Sets the Y axis scale to Linear (default) or Log.
A Log scale is useful when the component magnitudes cover a wide dynamic range, letting you
show both lesser- and greater-magnitude components on the same display.
A Linear scale is useful when the component magnitudes are all close in value, allowing direct
comparison of their magnitudes.
Menus and dialog boxes
324 MSO54, MSO56, MSO58, MSO58LP, MSO64 Help
 Loading...


