User's Manual 814 Document #: LTRT-27045
Mediant 1000B Gateway & E-SBC
50.3 Viewing Average Call Duration
You can view the number of currently active calls and the average call duration (ACD) in
the Web interface's Average Call Duration page. You can filter display by a specific SRD or
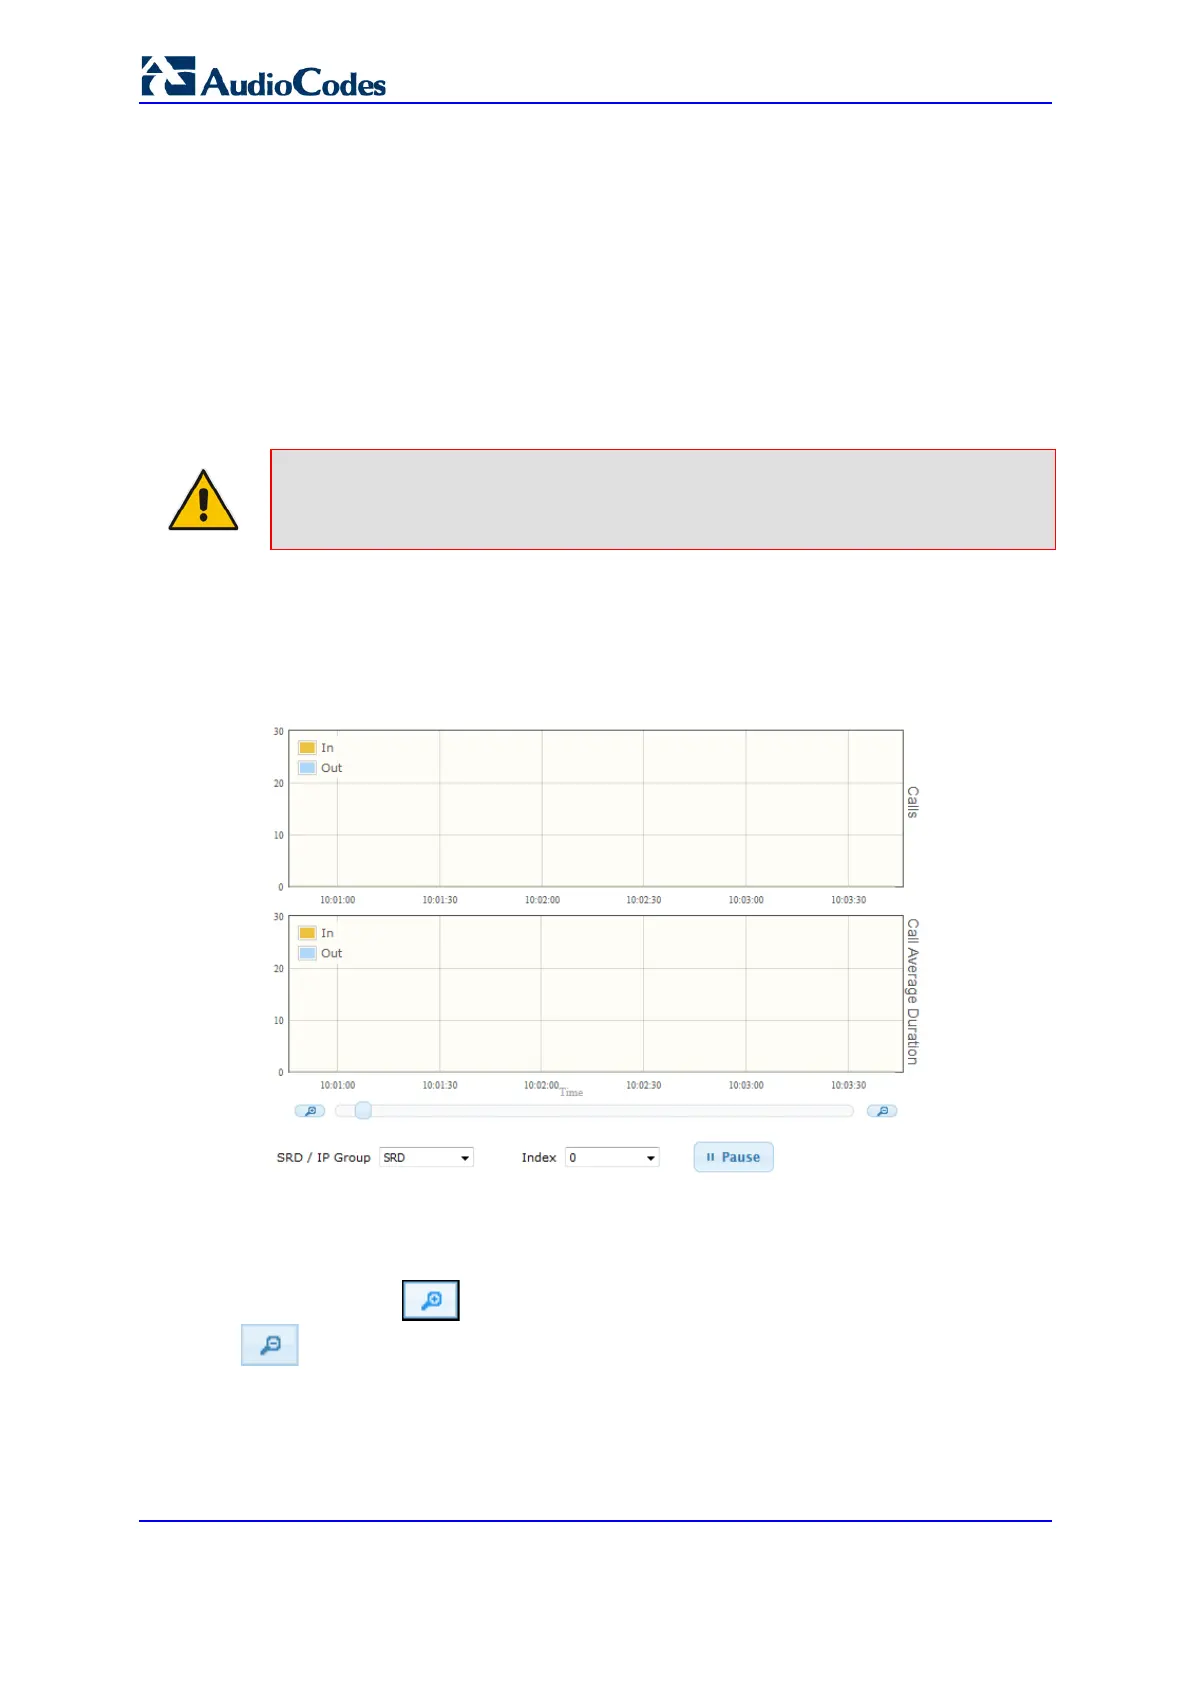
IP Group. The page displays the following two graphs:
Upper graph: Displays the number of currently active calls (INVITEs). The x-axis
indicates the time (hh:mm:ss) and the y-axis the number of calls.
Lower graph: Displays the ACD. The x-axis indicates the time (hh:mm:ss) and the y-
axis the average call duration. The ACD is refreshed every 15 minutes and therefore,
this value reflects the average duration of all established calls made within a 15
minute period.
Note: The Average Call Duration page is applicable only to SBC calls.
To view number of active calls and average call duration:
1. Open the Average Call Duration page (Monitor menu > Monitor tab > Performance
Monitoring folder > Average Call Duration).
Figure 50-3: Viewing Average Call Duration
2. From the 'SRD / IP Group' drop-down list, select the configuration entity (SRD or IP
Group).
3. From the 'Index' drop-down list, select the specific SRD or IP Group index.
Use the Zoom In button to increase the displayed time resolution or the Zoom Out
button to decrease it. Instead of using these buttons, you can use the slide ruler. As
you increase the resolution, more data is displayed on the graph. The minimum resolution
is about 30 seconds; the maximum resolution is about an hour.
To pause the graph, click the Pause button; click Play to resume.
 Loading...