10. USER CHARTS
10-3
10.3 How to Create a User Chart
You can create and modify a user chart in the Voyage planning mode.
To make a complete user chart, do the following:
1. Click the [PLAN] button on the Status bar to go to the Voyage planning mode.
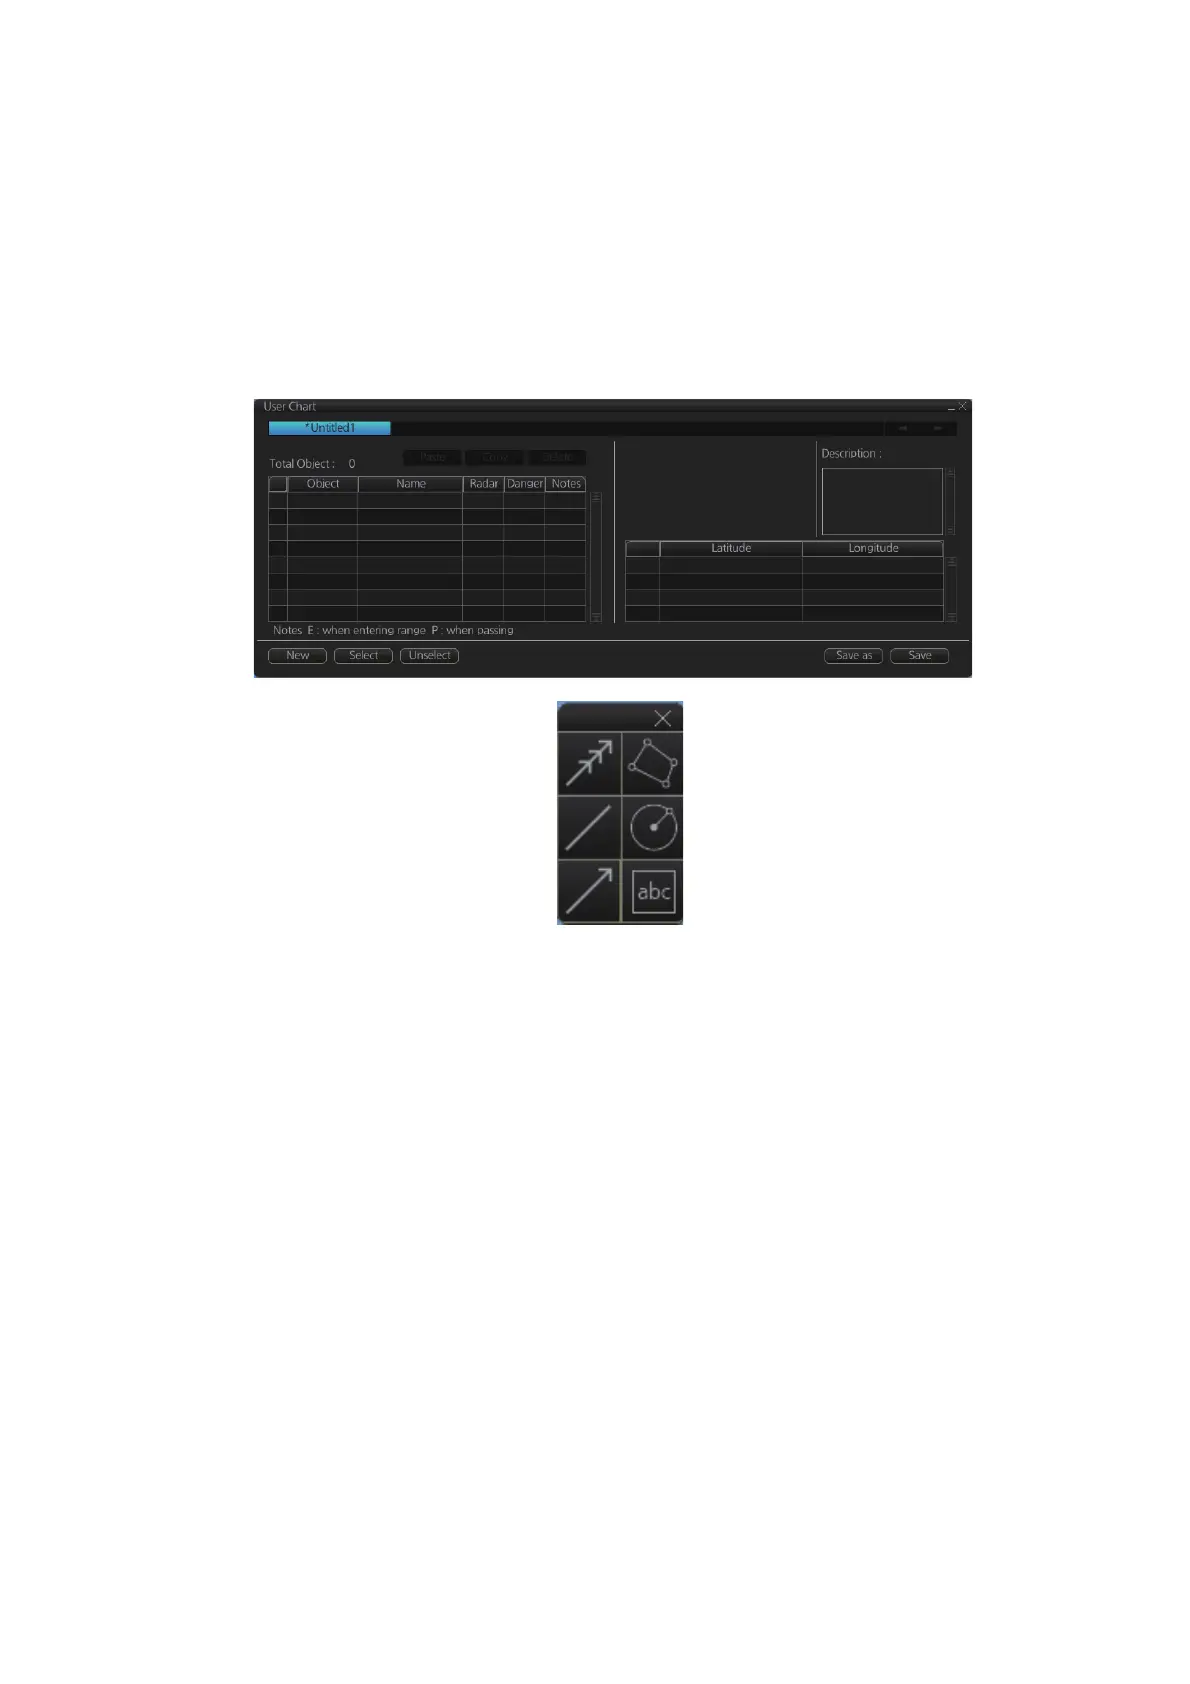
2. Click the [Planning] and [User Chart] buttons on the InstantAccess bar™ to show
the user chart palette and the [User Chart] dialog box.
3. Click the [New] button on the [User Chart] dialog box to create a new chart.
4. Click the desired object (button) on the palette. The [Tidal], [Line], [Clearing line]
and [Label] buttons have multiple choices. Right-click the respective button to
show a context sensitive menu. The choices available for each object are shown
below.
Tidal: Current, Predicted
Line: Coast, Nav, Route, Depth
Clearing line: NMT (Not More Than), NLT (Not Less Than)
Label: Point, Label
5. Put the cursor on the location to insert the object then push the left button. See
the figure below for how to construct lines, areas and circles. For the "Tidal" ob-
ject, you can set Orientation, Strength and Time from the dialog box. With the "La-
bel" object you can enter text and show that text on the screen.
Note: An object can also be put at the center of the screen. Do step 1-4 in this
procedure. On the [User Chart] dialog box, right click the box to the left of [Object]
then select [Add Object] from the pop-up menu.
Tidal
Line
Clearing
line
Area
Circle
Label
 Loading...