2. OPERATIONAL OVERVIEW
2-19
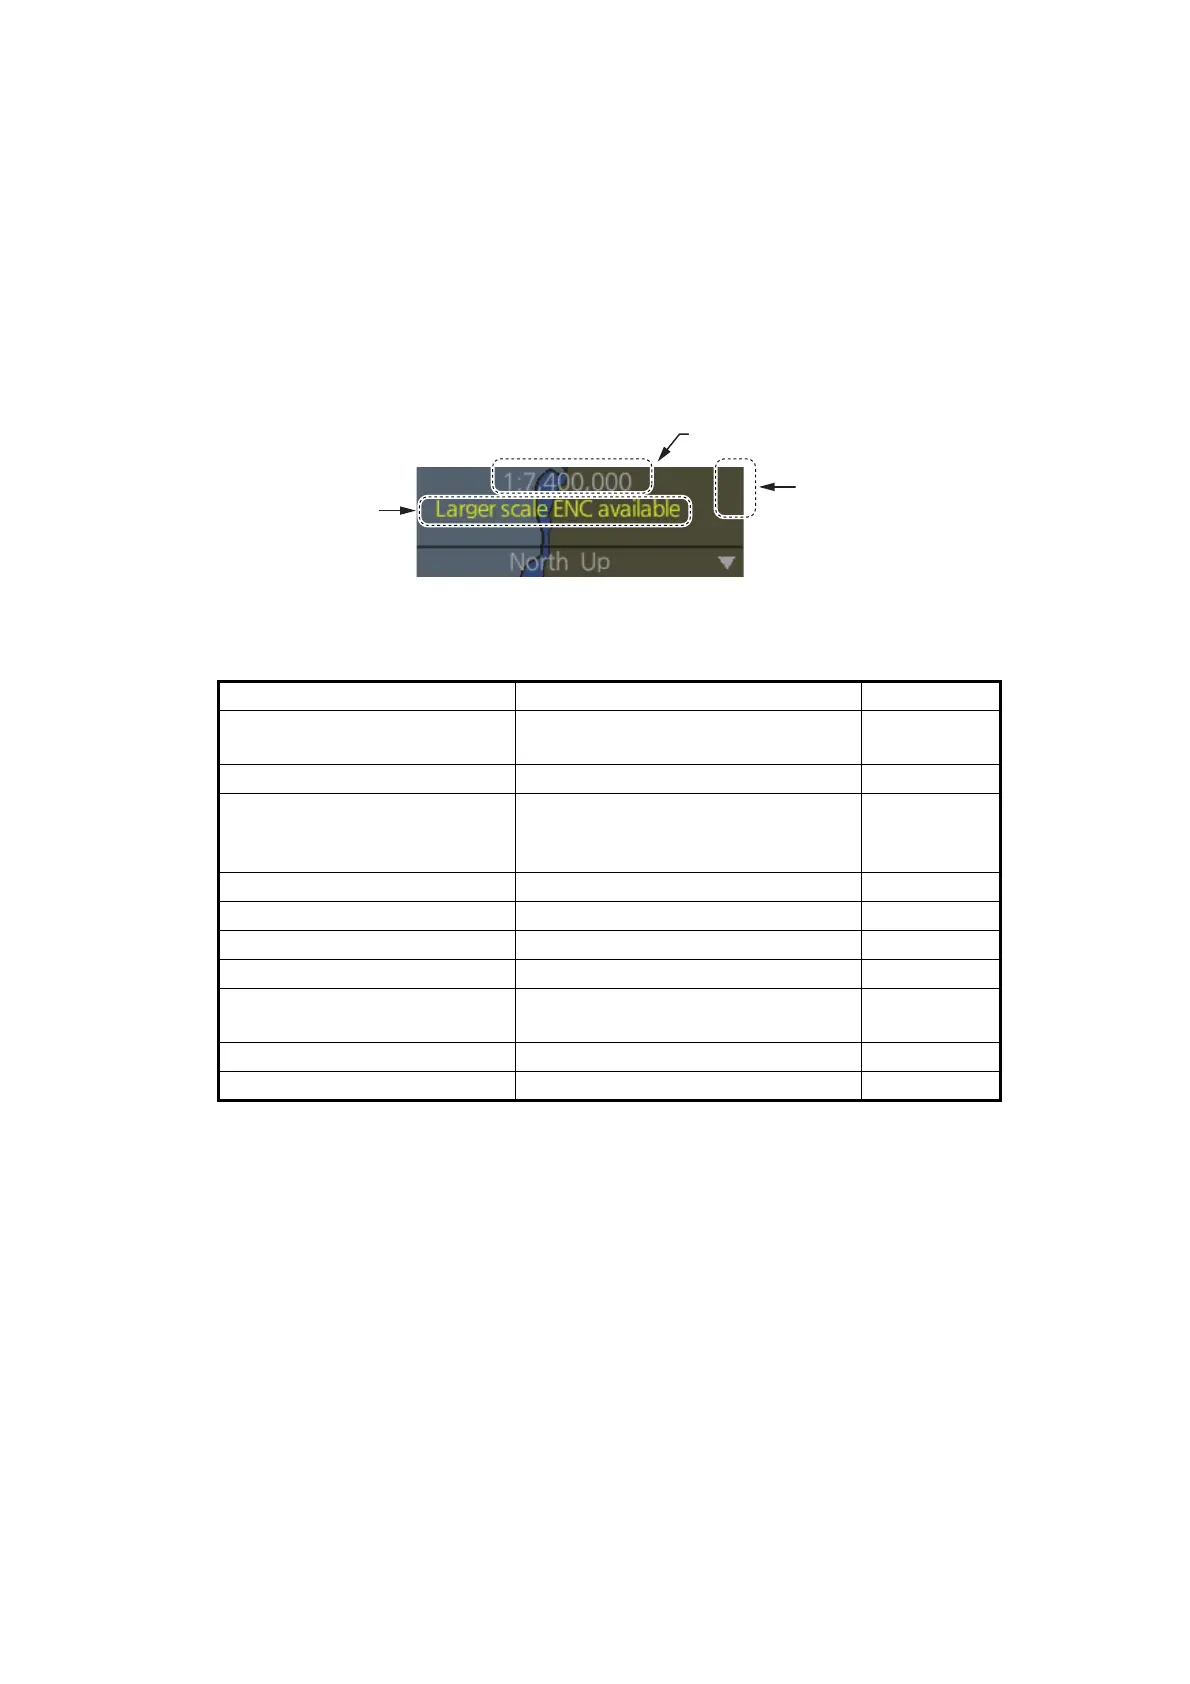
2.4 How to Select the Chart Scale
When you open a chart it is displayed with the default scale, called the compilation
scale. To change the chart scale, do one of the procedures shown below. The scale
range is 1:1,000 to 1:70,000,000.
• Click the chart scale selection buttons in the Chart scale/presentation mode box.
• Right-click anywhere inside the Chart scale/presentation mode to show a drop-
down list of chart scales.
• Put the cursor anywhere on the chart and spin the scrollwheel.
Note: When the radar overlay is active the chart scale is shown in nautical miles (NM).
The table below lists the chart related messages and their meanings.
*: Shown as "Display Not Real Time: display is based on viewing date range from
(start of date range) to (end of date range)" when the permanent warning dialog is
maximized.
Message Meaning Remarks
Display Not Real Time* Displayed date is not the current
date.
Non-ENC data ENC non-compatible chart in use.
Larger scale ENC available Larger scale available at current
position (TM reset ON) or cursor
location (TM reset OFF).
Overscale Scale too large.
RNC data RNC chart in use. ARCS only
Larger RNC available Larger RNC is available. ARCS only
Underscale Scale too small. ARCS only
ENC data available ENC data available for current
area.
ARCS only
WGS shift undefined WGS shift is not defined. ARCS only
RM(OFF) Relative motion off.
Chart scale indication
Chart scale
selection buttons
Chart related
message
 Loading...