CHAPTER 4: SETPOINTS FLEXLOGIC
869 MOTOR PROTECTION SYSTEM – INSTRUCTION MANUAL 4–361
Viewing FlexLogic
Graphics
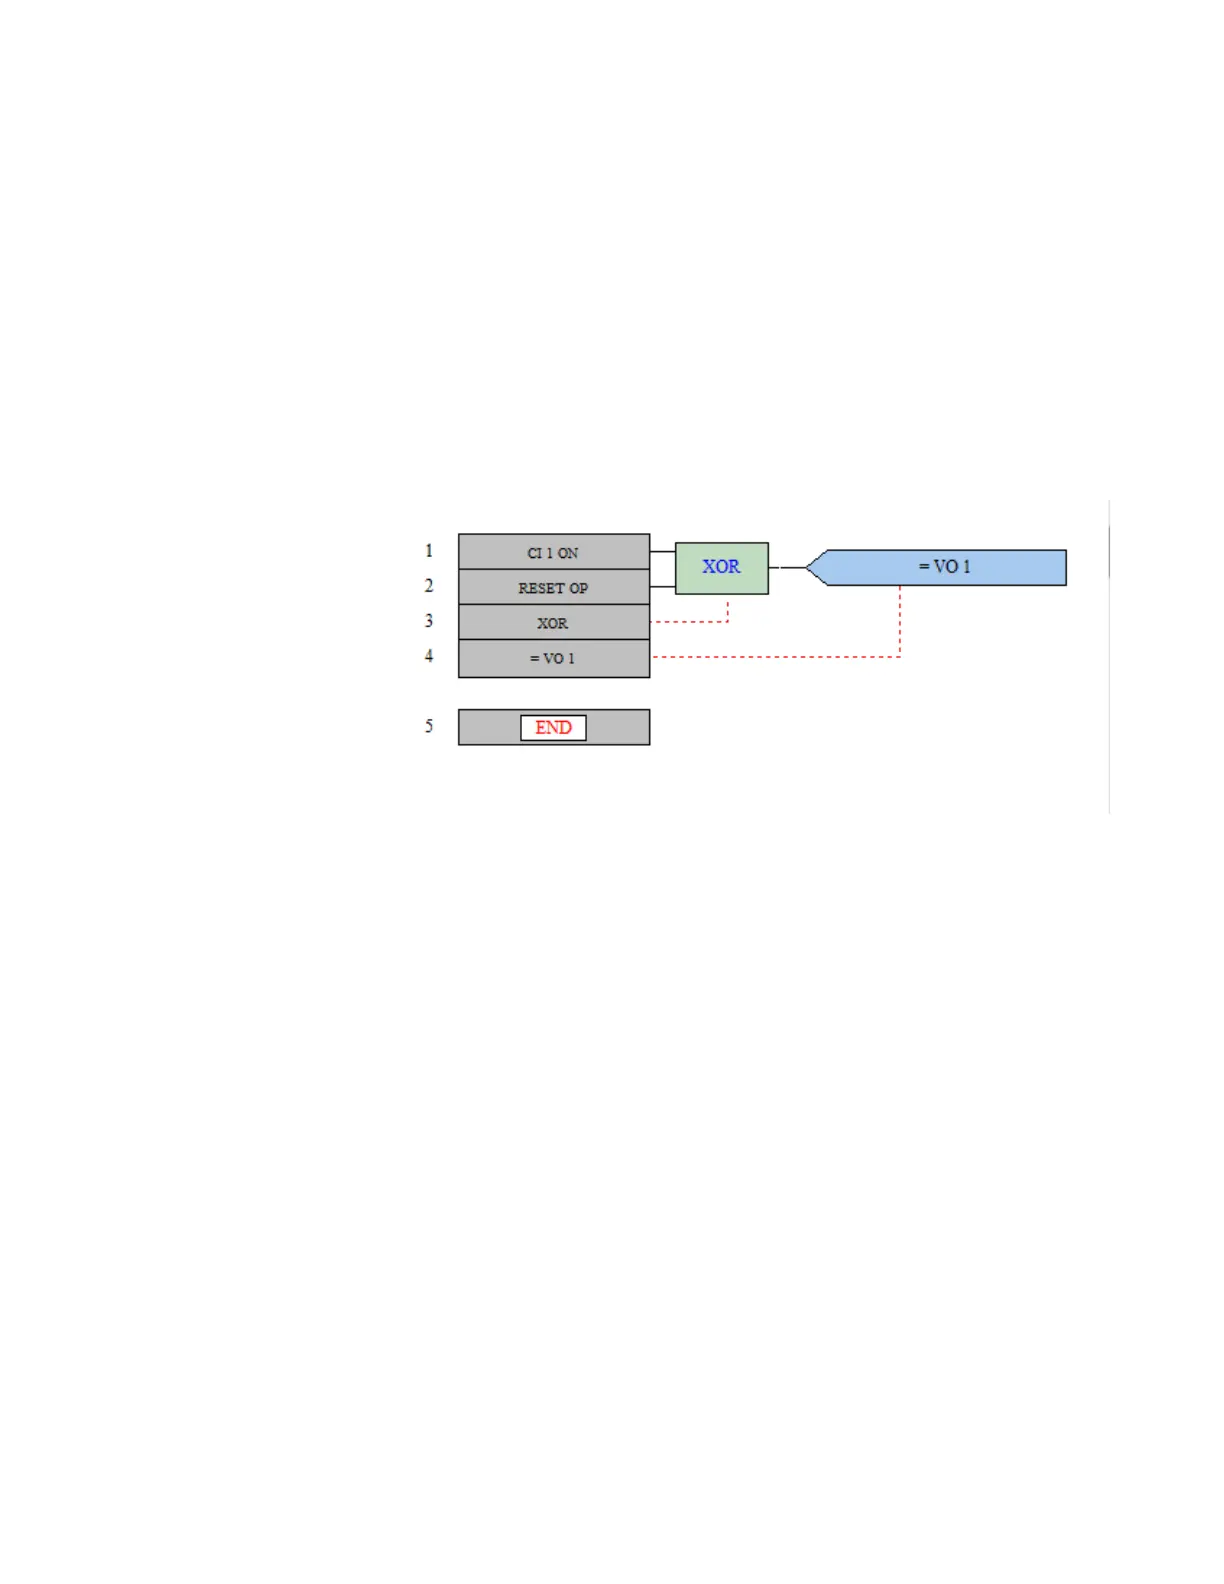
To verify that the FlexLogic equation(s) and its selected parameters produce the desired
logic, the expression can be viewed by converting the derived equation into a graphic
diagram. It is strongly recommended and helpful to view an equation as a graphic diagram
before it is saved to the 869 device in order to troubleshoot any possible error in the
eq
uation.
To View the FlexLogic Graphic
Click on the View button at the top of the Type column in the FlexLogic Equation screen,
se
e previous figure. Provided the equation is entered correctly, this generates a graphical
representation of the expression previously entered. If any operator inputs are missing or
any FlexLogic rules have been violated, the EnerVista 8 Series Setup software displays a
message box ind
icating any problems in the equation when the view feature is attempted.
The expression is also listed to the left of the diagram to demonstrate how the diagram
w
as created. The End statement is added as parameter 5 (End of list).
Figure 4-145: Flexlogic Graphic Example
 Loading...