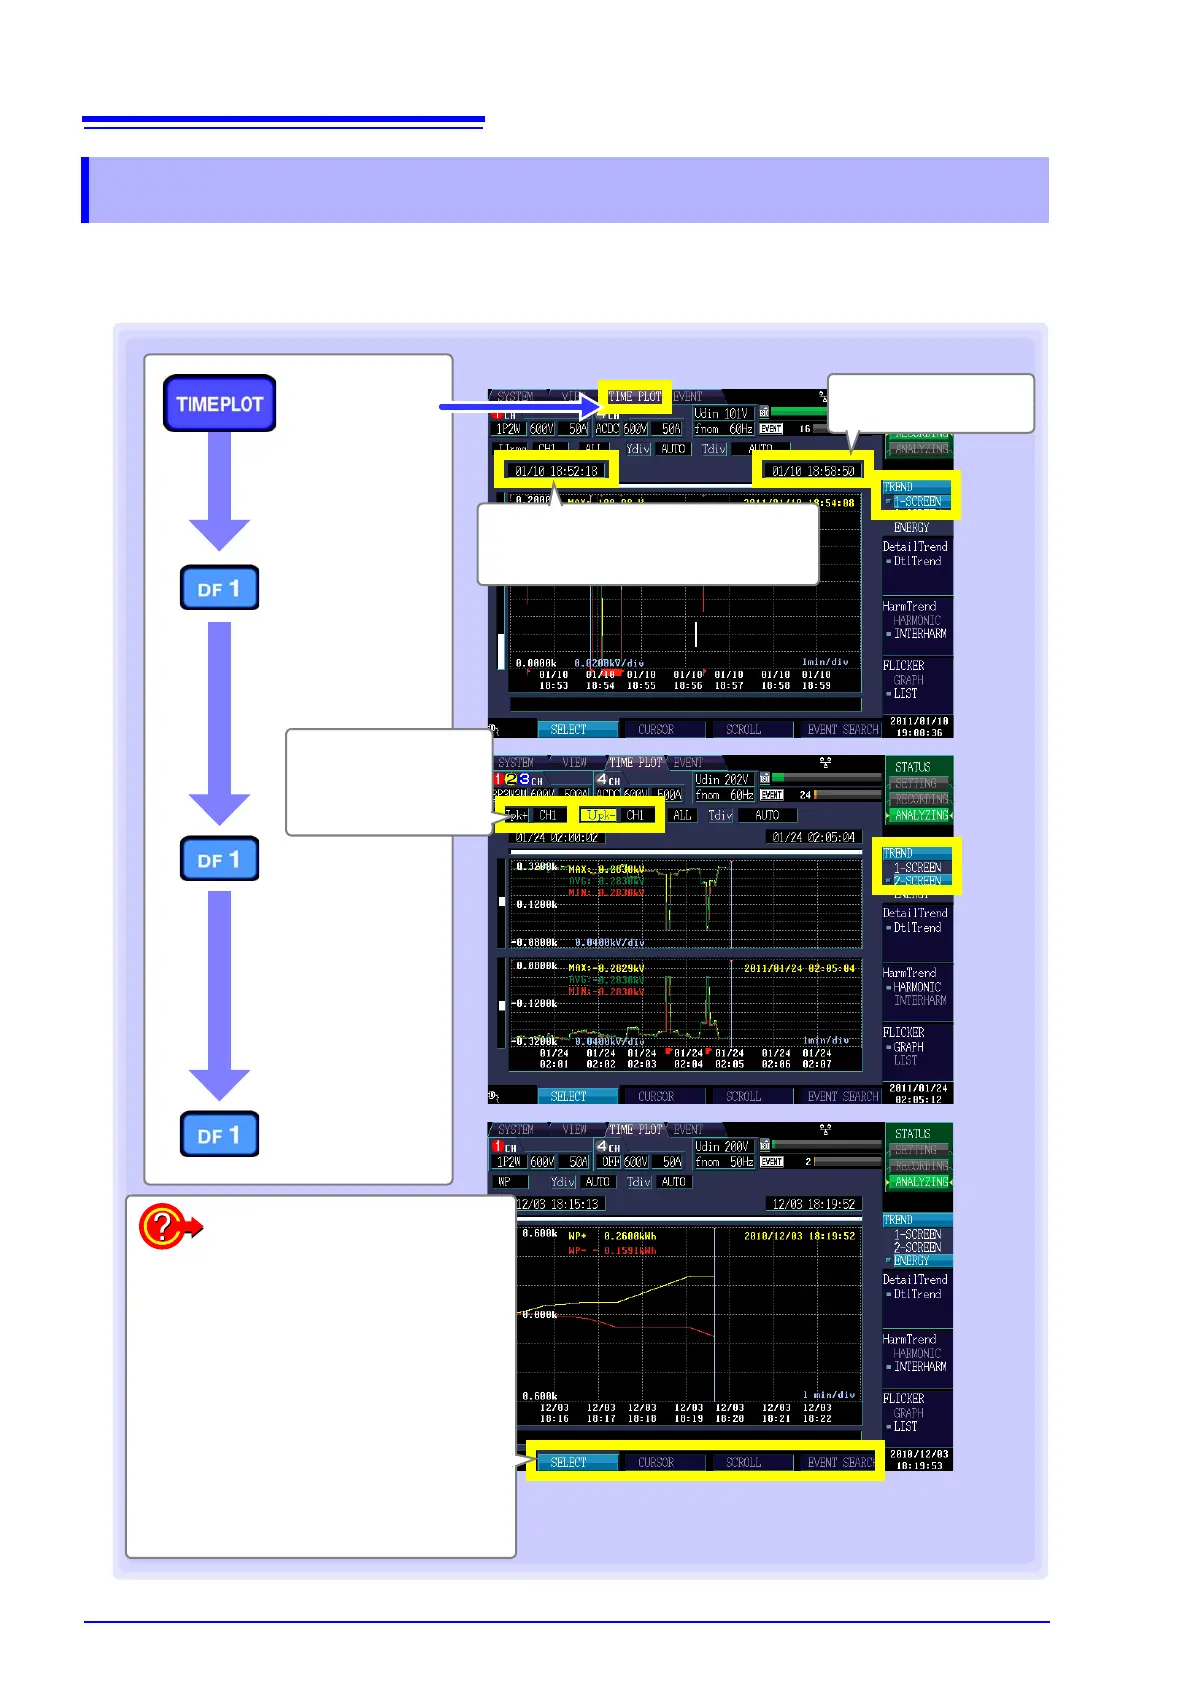
each TIMEPLOT interval. When using one or two screens, the maximum, minimum, and average values
Select with the F key.
To change the displayed characteristic,
channel, waveform, or measured value
(when displaying [1-SCREEN] or [2-
SCREEN] screen) (p.95)
To change the displayed characteristic
(when displaying [ENERGY] screen) (p.97)
To enlarge or reduce the graph (p.98)
To view the value and time over the
cursor (p.99)
To scroll through display data (p.99)
To search for an event (p.100)
[TIME PLOT]
screen
[TREND]
[1-SCREEN]
Example: 3P4W (3-phase, 4-wire)
When displaying
[2-SCREEN], you can
select two characteris-
tics to display.
[TREND]
[2-SCREEN]
[TREND]
[ENERGY]
Initial time in displayed data
(One interval time prior to that displayed
for cursor measurement)
Final time in displayed
data
 Loading...