7.5 Displaying Flicker Values in Graph and List Form
118
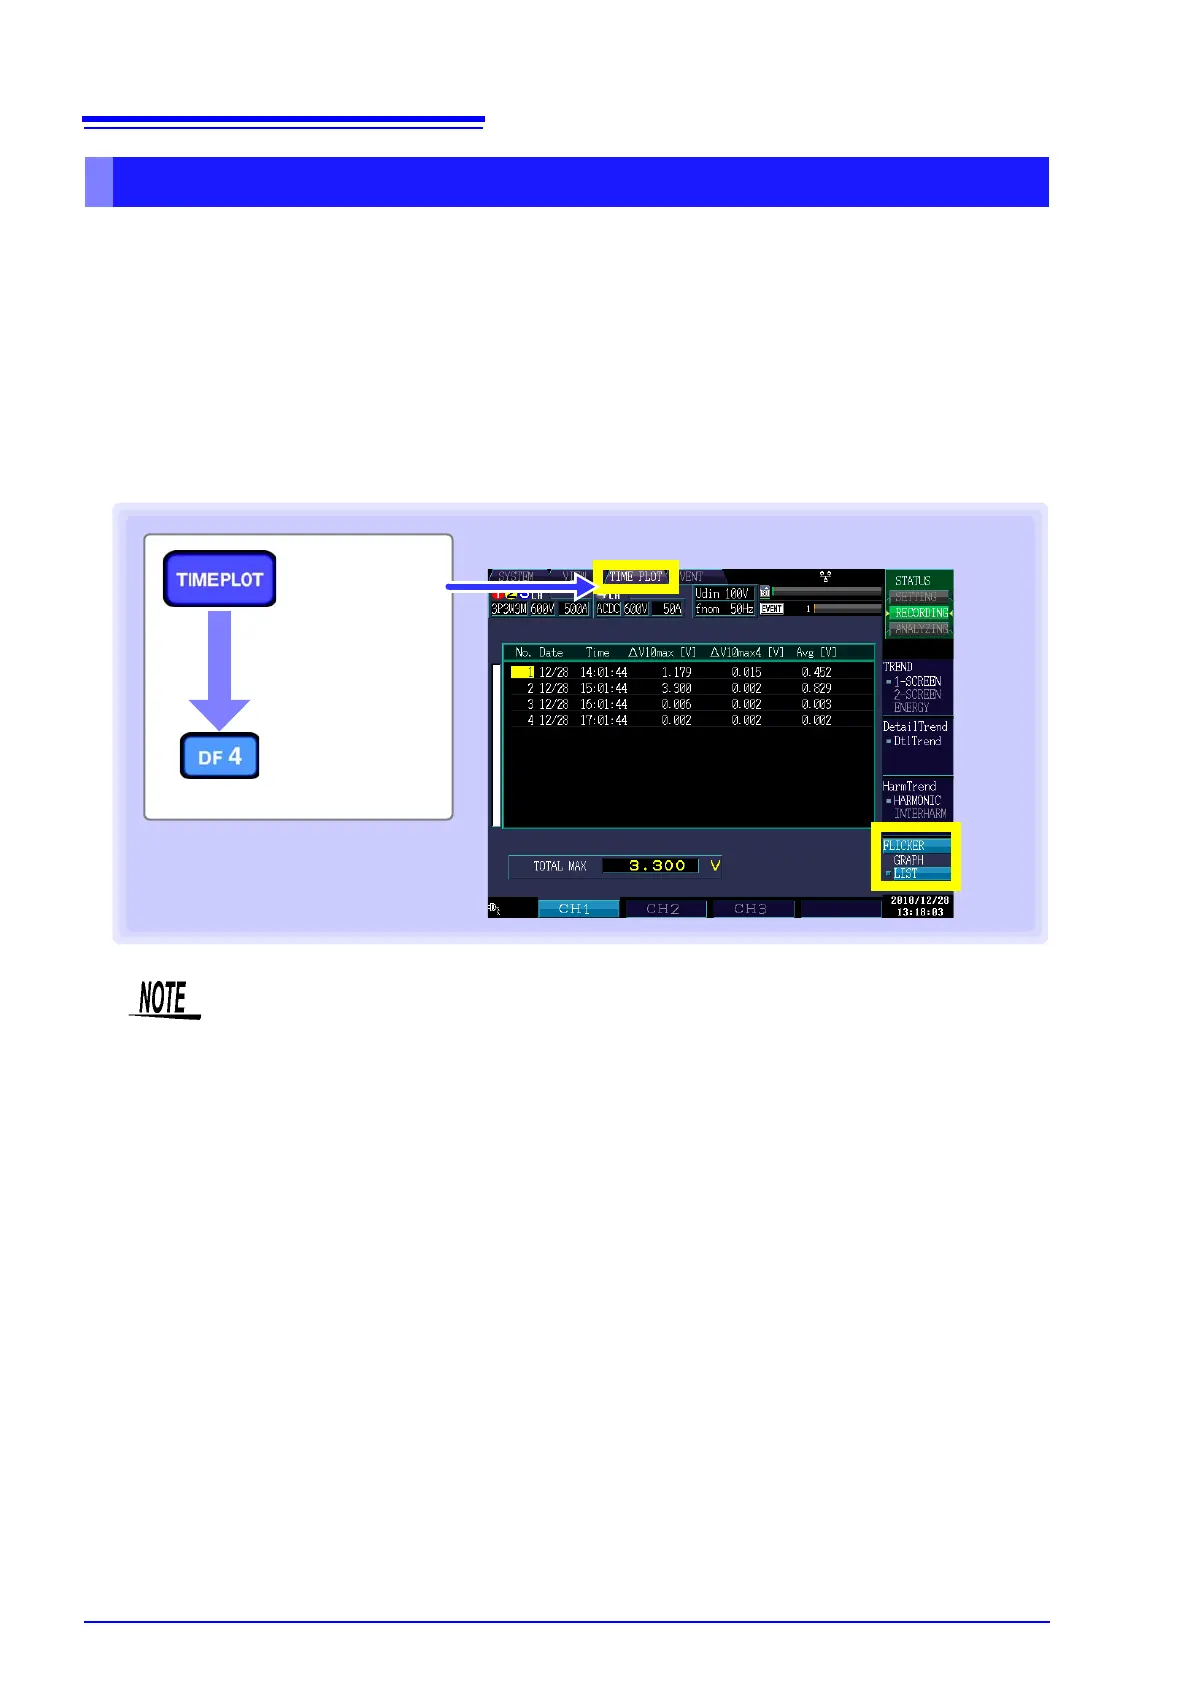
This section describes how to display the following V10 flicker statistics along with the time and date
once an hour:
• V10 flicker 1-hour maximum value
• V10 flicker 1-hour fourth-largest value
• V10 flicker 1-hour average value
V10 flicker statistics for the measurement period are displayed. Each V10 value is updated once a minute.
• V10 flicker overall maximum value
Displaying a V10 flicker list
[TIME PLOT]
screen
[FLICKER]
[LIST]
• Statistics are updated once an hour, and the V10 flicker overall maximum value is
updated once a minute.
• The list is not displayed unless [Flicker] is set to [DV10] in [SYSTEM]-DF1 [MAIN]-F1
[MEASURE].
• In Japan, the average (V10 flicker 1-hour average value) and maximum (V10 flicker
1-hour maximum value, 1-hour fourth-largest value, or overall maximum value) limit val-
ues for V10 flicker are 0.32 V and 0.45 V, respectively.

 Loading...