7.5 Displaying Flicker Values in Graph and List Form
111
Chapter 7 Monitoring Fluctuations in Measured Val-
7
Flicker meters are used to measure the sensation of visual instability that occurs due to changes in light
source brightness and wavelength. There are two types of flicker meters: IEC flicker meters (UIE flicker
meters), which comply with IEC standards, and V10 flicker meters, which are used domestically in
Japan. Both types of flicker meter observe fluctuations in voltage and display values used to objectively
judge flicker.
This section describes how to display an IEC flicker fluctuation graph.
7.5 Displaying Flicker Values in Graph and List
Form
Flicker measurement cannot be performed during 400 Hz measurement.
IEC flicker meters and V10 flicker meters
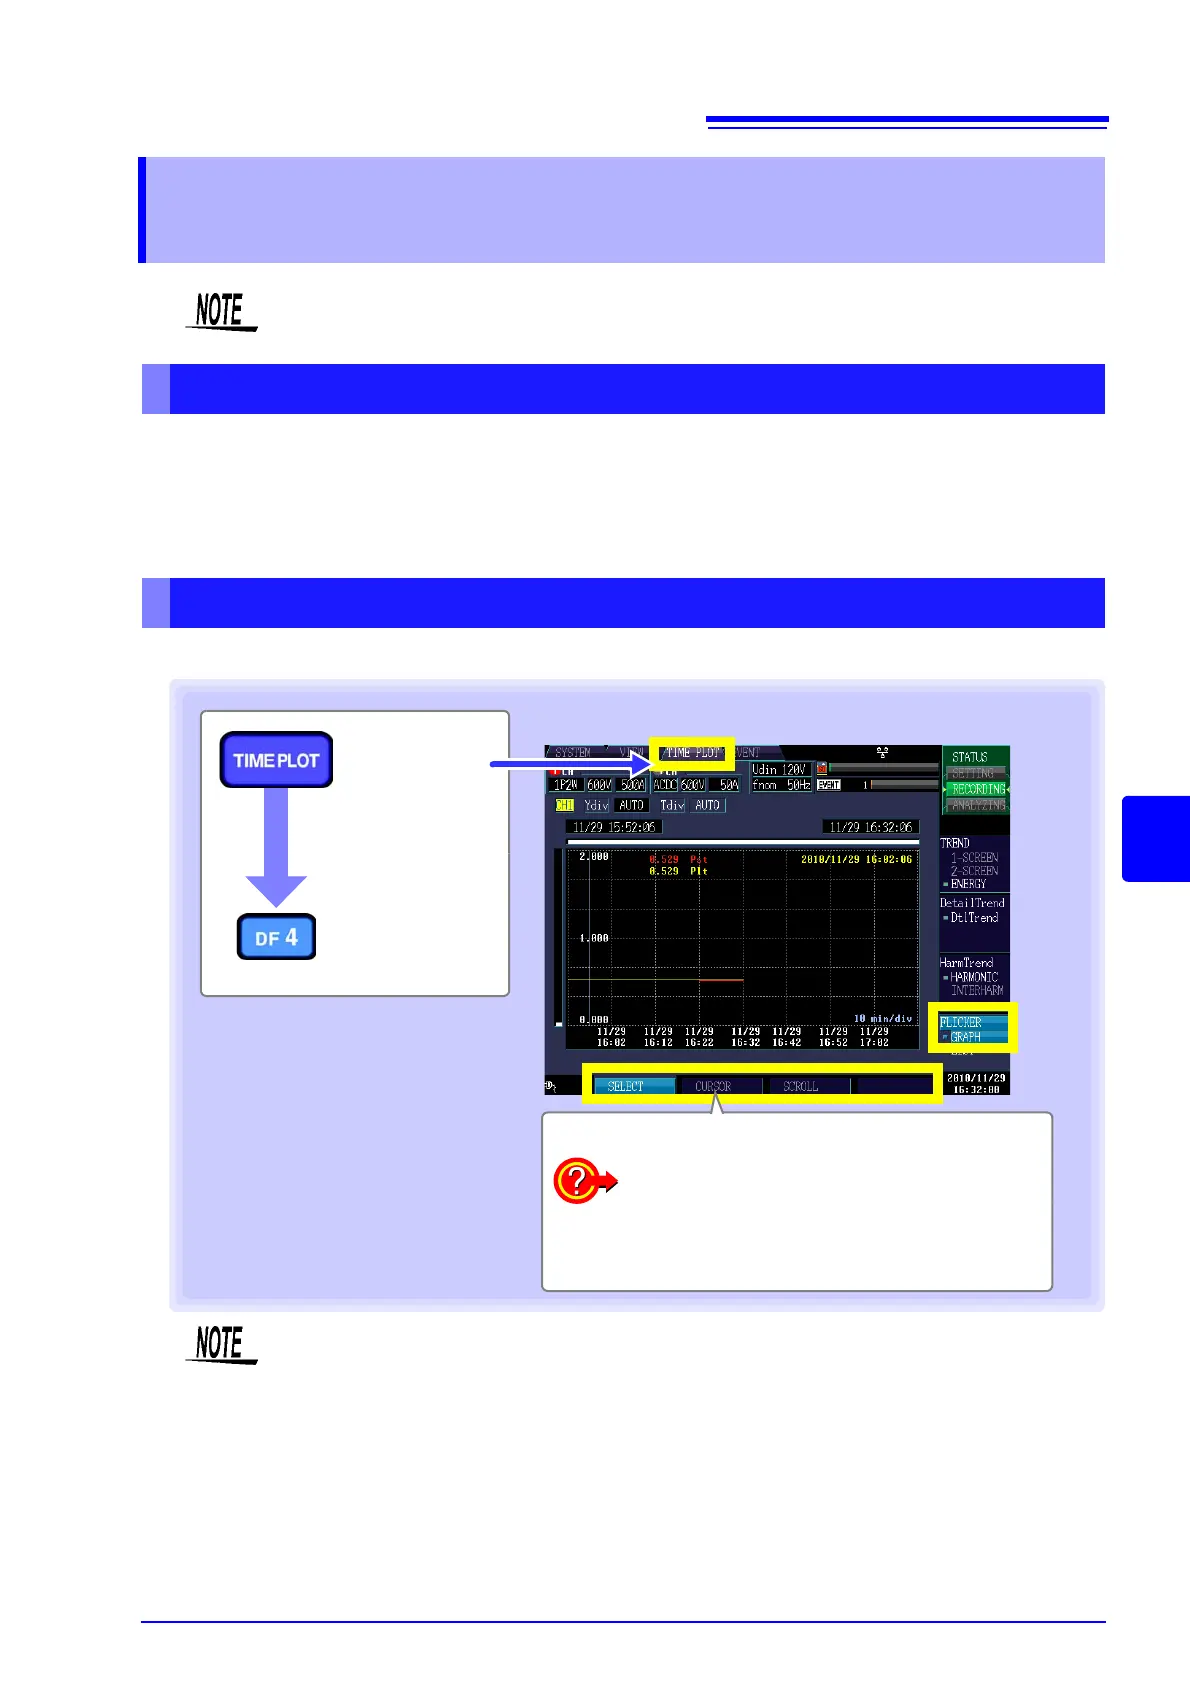
Displaying an IEC flicker fluctuation graph
[TIME PLOT]
screen
[FLICKER]
[GRAPH]
Select with the F key.
To change the displayed channels (p.112)
To enlarge or reduce the graph (p.112)
To read the value above the cursor (p.113)
To scroll waveform data (p.113)
• The graph is updated every 10 minutes, regardless of the [TIMEPLOT Interval] set
in SYSTEM-DF1 [RECORD] (p.63).
• The graph is not displayed unless [Flicker] is set to [Pst, Plt] in [SYSTEM]-
DF1
[MAIN]-F1 [MEASURE].
• Urms1/2, Irms1/2, Freq_wav, and S(t) are recorded continuously.
• Due to the influence of the high pass filter used, measured values are unstable when
starting Pst, Plt measurement immediately after settings have been configured, and the
initial measured value may be excessively high. It is recommended to wait about 2 min-
utes after making settings on the [SYSTEM] screen before starting measurement.
 Loading...