7.3 Displaying detailed trends
101
Chapter 7 Monitoring Fluctuations in Measured Val-
7
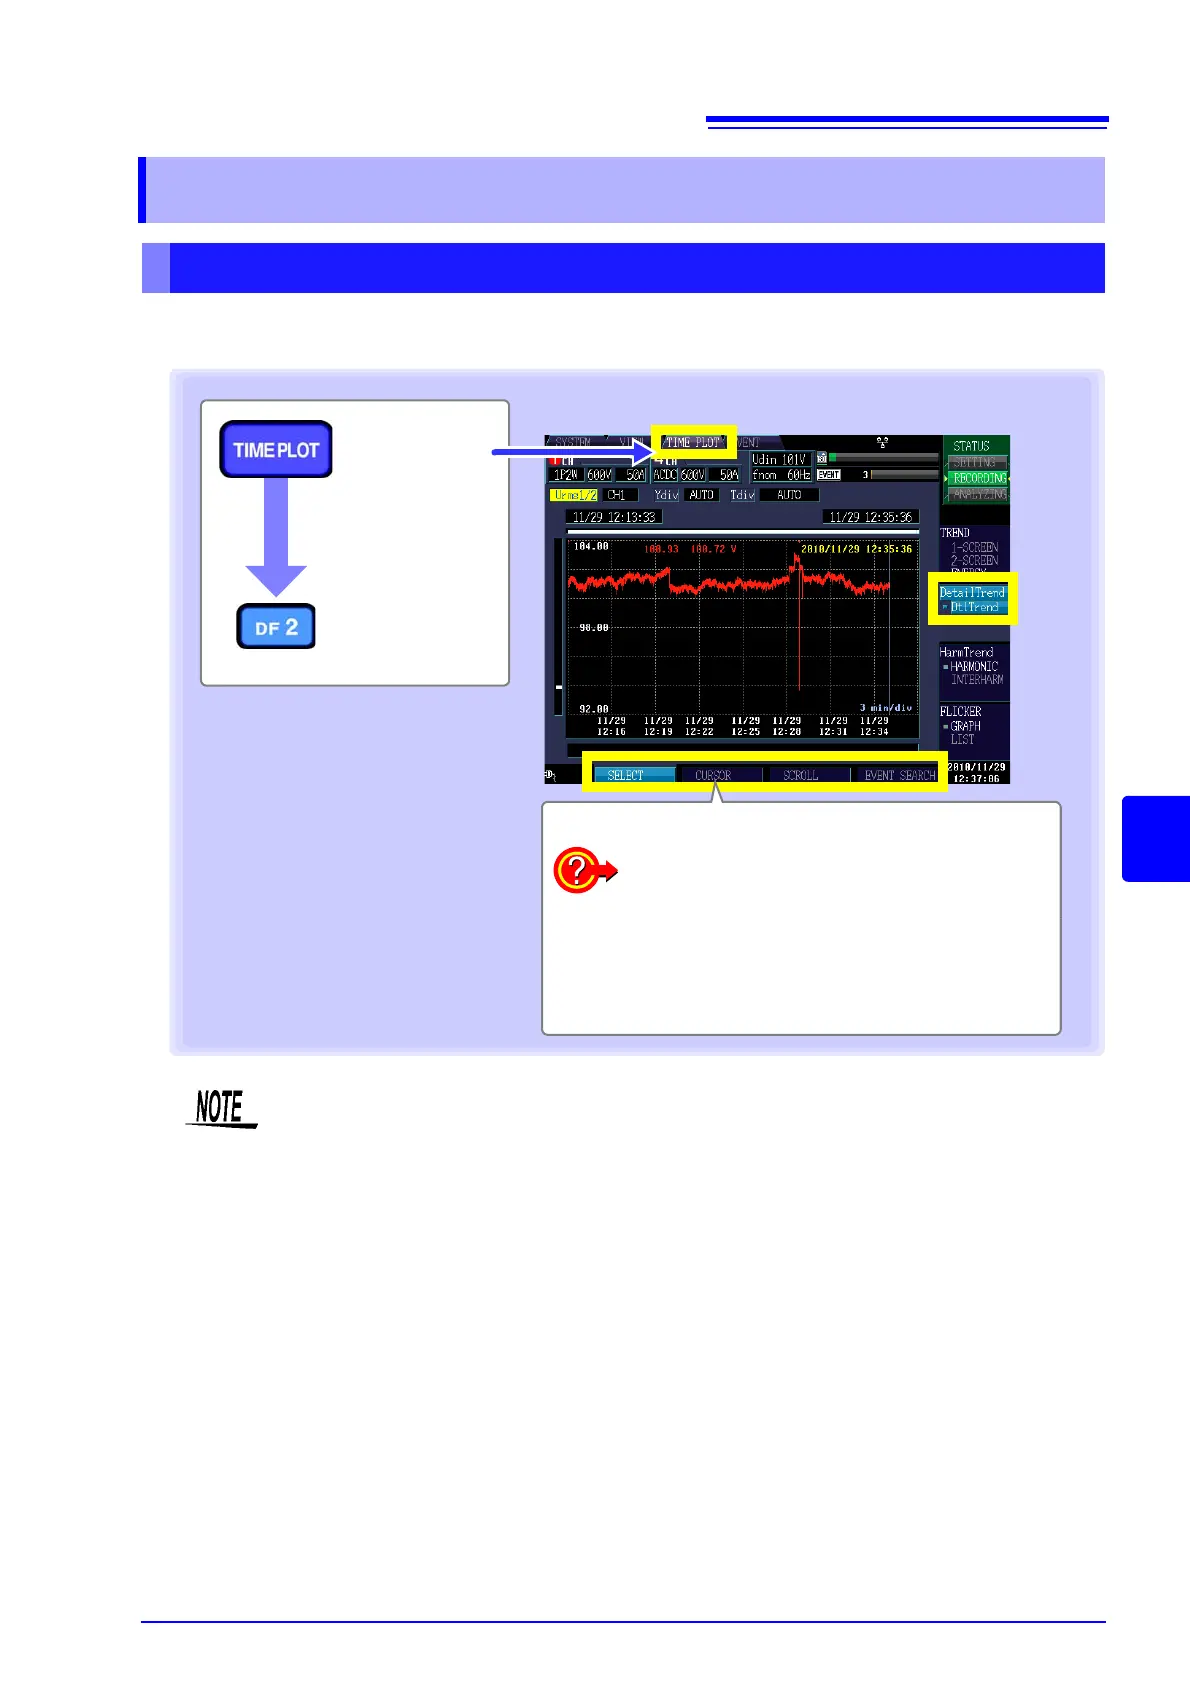
This section describes how to display a time series graph for each TIMEPLOT interval for Urms1/2,
Irms1/2 (inrush current), S(t), or one frequency cycle.
7.3 Displaying detailed trends
Displaying a detailed trend graph for each TIMEPLOT interval
[DetailTrend]
Example: 3P4W (3-phase, 4-wire)
Select with the F key.
To change displayed items and displayed
channel (p.102)
To enlarge or reduce the graph (p.103)
To read the value above the cursor (p.104)
To scroll through display data (p.105)
To search for an event (p.106)
Waveform/measured value colors
when displaying CH1/2/3 data
Red : CH1
Yellow : CH2
Blue : CH3
[TIME PLOT]
screen
Unlike trend data, which consists of one graph each for the maximum, minimum, and aver-
age values, detailed trend data is displayed as a single graph with vertically connected
bands between the maximum and minimum values.
 Loading...