7.4 Displaying Harmonic Trends
107
Chapter 7 Monitoring Fluctuations in Measured Val-
7
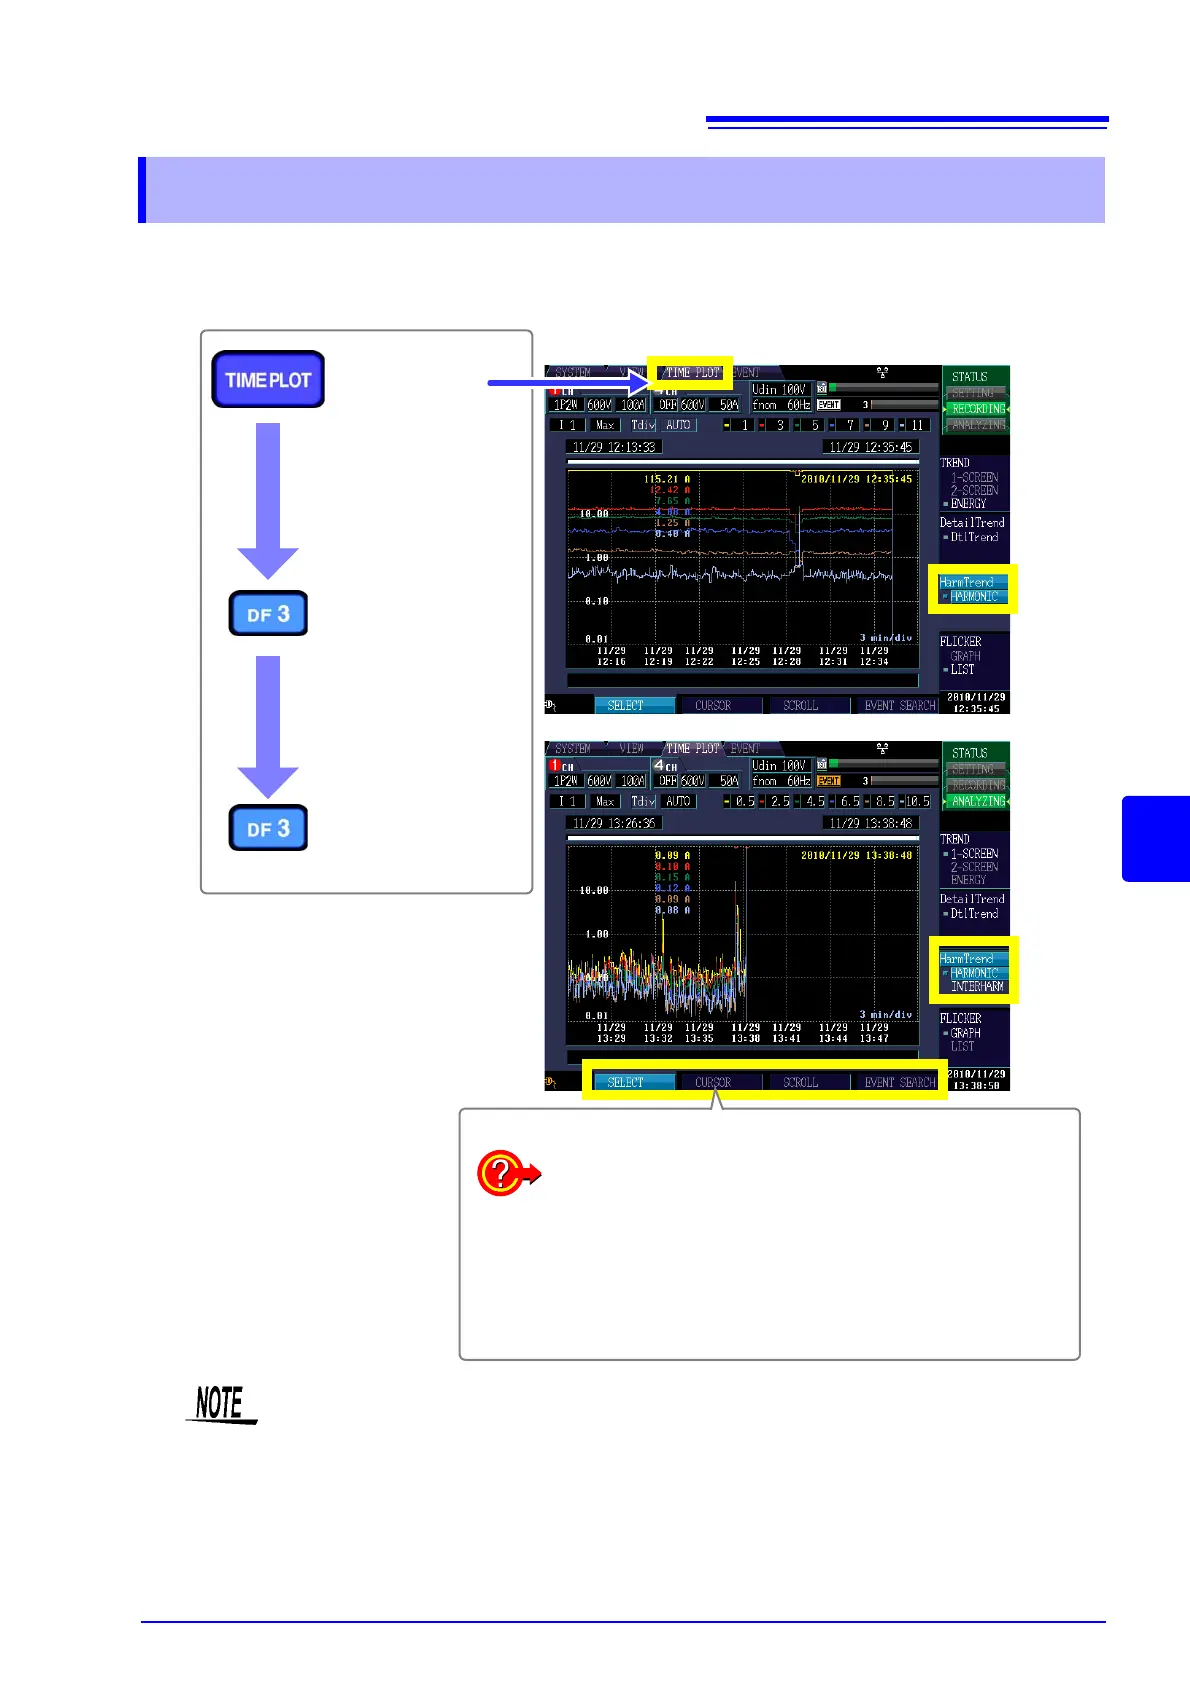
This section descries how to select six orders and display their harmonic time series graphs. The maxi-
mum, minimum, or average value during the TIMEPLOT interval can be displayed.
7.4 Displaying Harmonic Trends
[TIME PLOT]
screen
[HarmTrend]
[HARMONIC]
Example: 3P4W (3-phase, 4-wire)
Select with the F key.
To change displayed items/waveform/measurement
value (p.108)
To enlarge or reduce the graph (p.108)
To change display number of order (p.108)
To read the value above the cursor (p.109)
To scroll waveform data (p.110)
To search for an event (p.110)
[HarmTrend]
[INTERHARM]
• When [Power] is selected under the [Recording Items] settings (see SYSTEM-DF1
[RECORD] (p.62)), harmonic trends (the harmonic trend graph and inter-harmonic trend
graphs) will not be displayed. Additionally, inter-harmonic trend data will not be displayed
if [P&Harm] is selected.
• During 400 Hz measurement, harmonic analysis is performed up to the 10th order, and
inter-harmonic analysis is not available.
 Loading...