7.5 Displaying Flicker Values in Graph and List Form
115
Chapter 7 Monitoring Fluctuations in Measured Val-
7
This section describes how to display a V10 flicker fluctuation graph.
V10 flicker reference voltage
In V10 flicker measurement, the reference voltage is automatically set internally using AGC (automatic
gain control).
Once the fluctuating voltage value has stabilized, the reference voltage is automatically changed to that
value. Consequently, there is no need to switch supply voltage settings as with conventional V10 flicker
meters.
(Example)
Fluctuating voltage: Stabilizes at 96 Vrms The reference voltage is automatically changed to 96 V rms.
Fluctuating voltage: Stabilizes at 102 Vrms The reference voltage is automatically changed to 102 V rms.
Due to the influence of the high pass filter used in V10 flicker measurement, measured values are
unstable when starting V10 measurement immediately after settings have been configured, and the first
and second V10 measured values may be excessively high. It is recommended to wait about 5 minutes
after making settings on the [SYSTEM] screen before starting measurement.
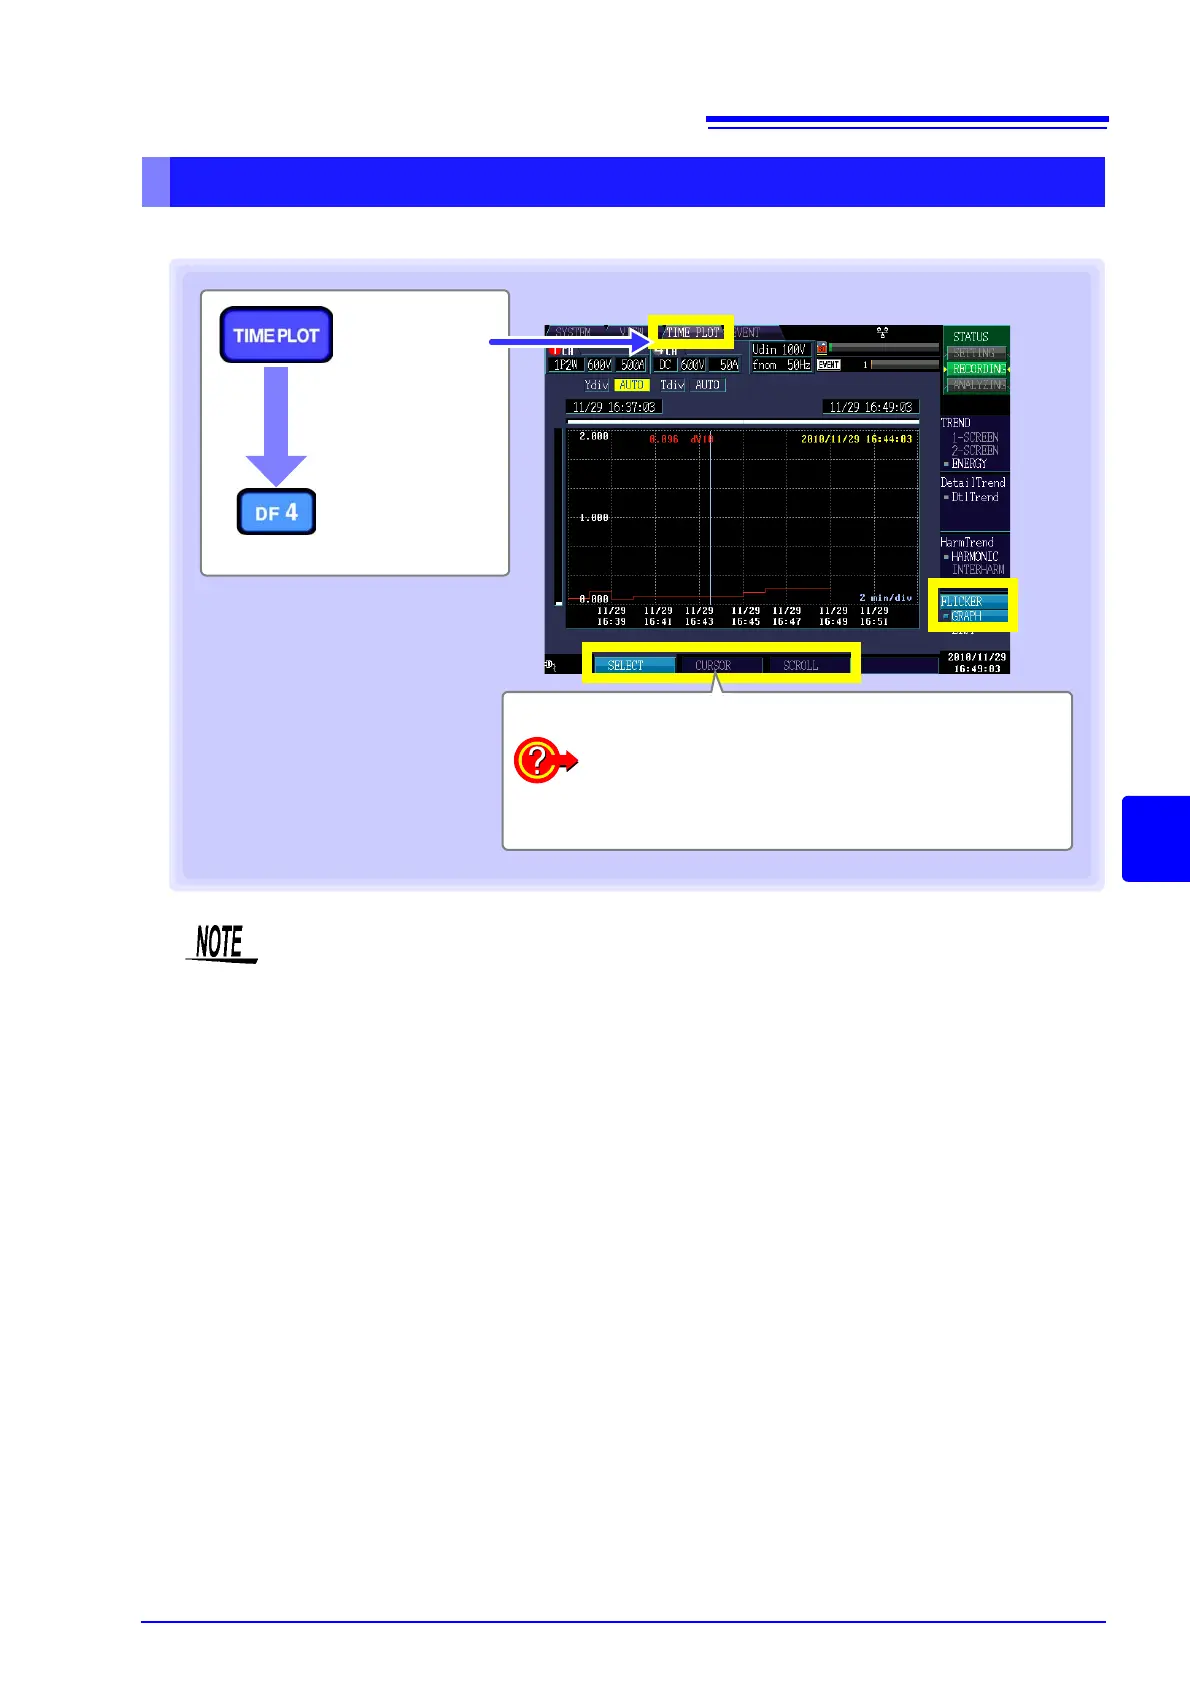
Displaying a V10 flicker fluctuation graph
[TIME PLOT]
screen
[FLICKER]
[GRAPH]
Select with the F key.
To enlarge or reduce the graph (p.116)
To read the value above the cursor (p.117)
To scroll waveform data (p.117)
1
• The graph is updated once a minute, regardless of the TIMEPLOT interval set in [SYS-
TEM]-DF1 [RECORD].
• The graph is not displayed unless [Flicker] is set to [DV10] in [SYSTEM]-DF1 [MAIN]-
F1 [MEASURE].
• V10 flicker can be measured simultaneously for the voltage channels U1, U2, and U3
(depends on connection).
 Loading...