Appendix 4 Recording TIMEPLOT Data and Event Waveforms
A
14
Appendix 4 Recording TIMEPLOT Data and Event
Waveforms
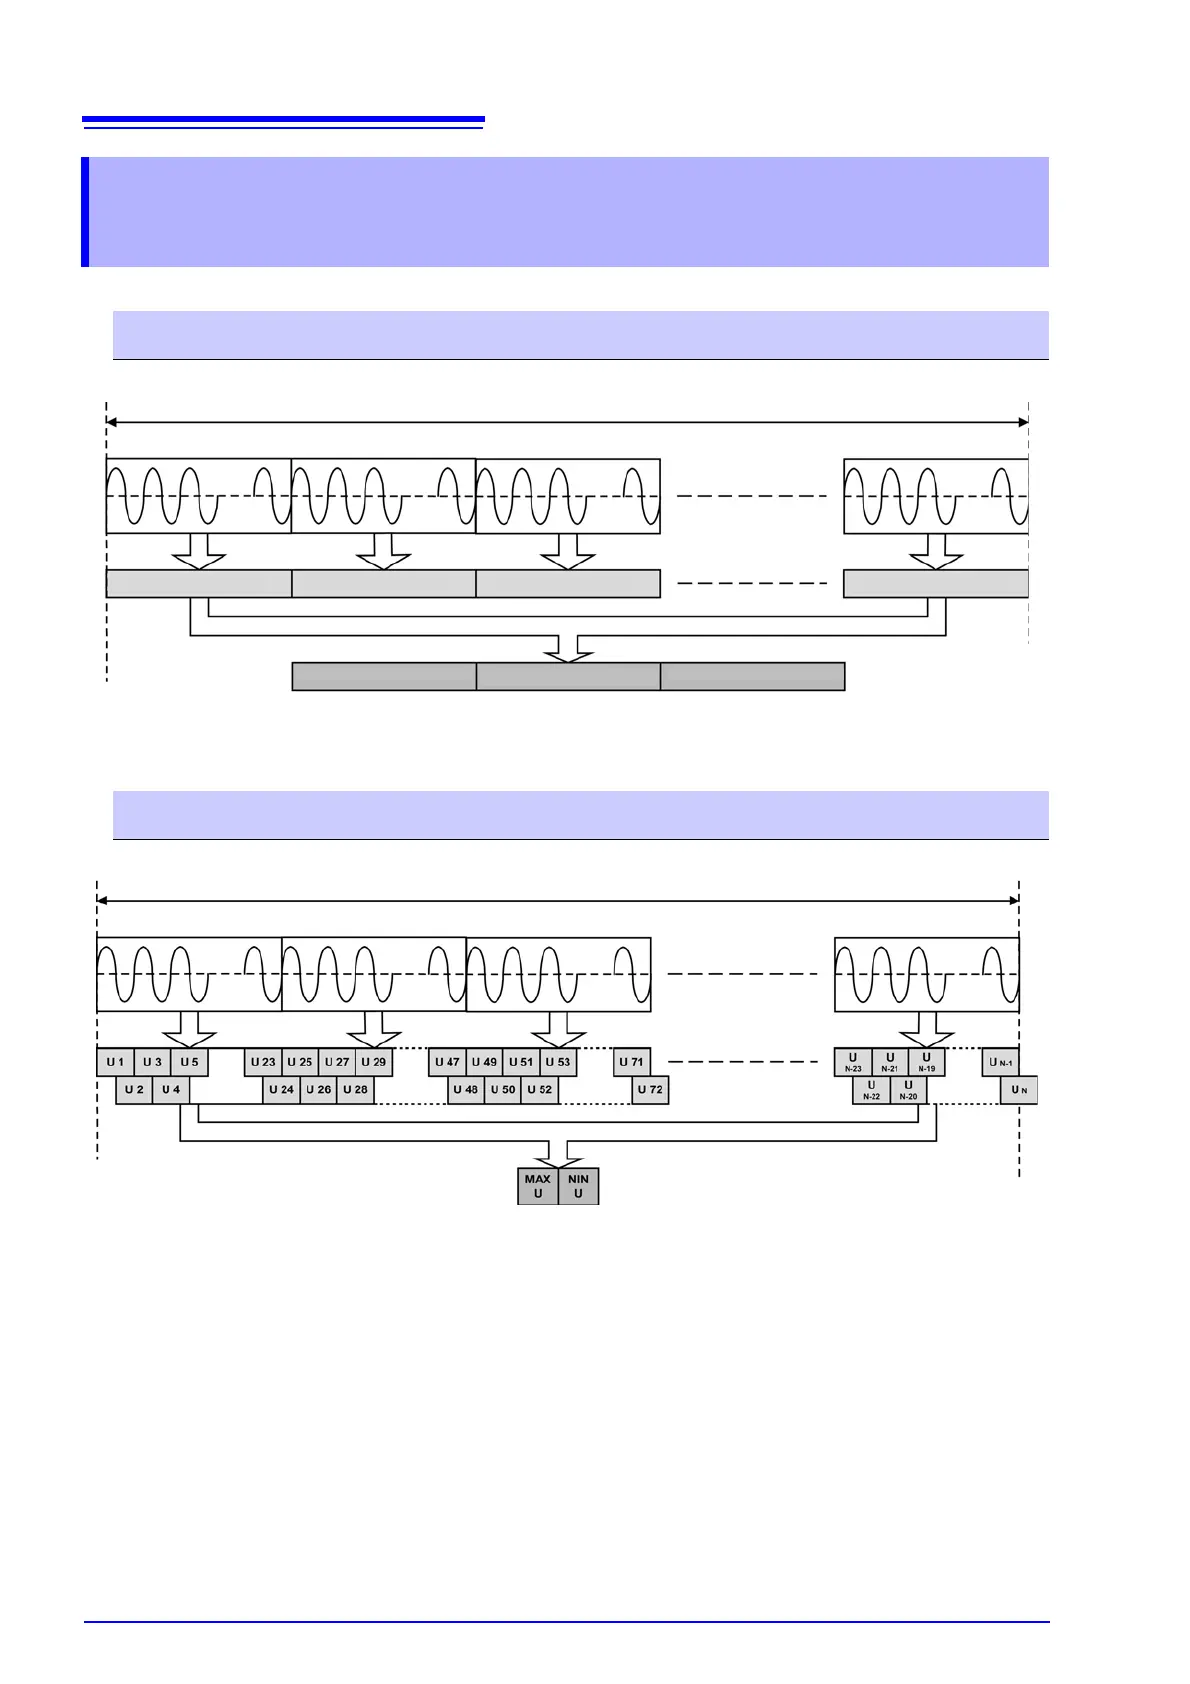
TIME PLOT screen (trends and harmonic trends)
SYSTEM_DF1 [RECORD] TIME PLOT Interval (setting period)
Approx. 200 ms aggregation (50 Hz: 10 cycles, 60 Hz: 12 cycles)
RMS value 1 RMS value 2 RMS value 3 RMS value N
Example:
when interval:1min,
N=300
MAX RMS value AVG RMS value MIN RMS value
Recording Recording Recording
TIME PLOT screen (detailed trends)
SYSTEM_DF1 [RECORD] TIME PLOT Interval (setting period)
Approx. 200 ms aggregation (50 Hz: 10 cycles, 60 Hz: 12 cycles)
Voltage RMS value is calculated for one
waveform shifted over half a wave.
Example:
There are 24 calculated U (Urms1/2) values
in an approx. 200 ms aggregation at 60 Hz
(12 cycles).
RecordingRecording
Example:
when interval:1min,
N=7200
 Loading...