RMS voltage, RMS current, and other measured val-
ues calculated every 200 ms are displayed as a time
series graph. The maximum, minimum, and average
values during the TIMEPLOT interval are recorded.
Example
If the TIMEPLOT interval is set to 1 s, five values will
be calculated in 1 s. Of those, the maximum, minimum,
and average values will be recorded.
135
50 Hz: 10 waveforms, 60 Hz: 12 waveforms, 400 Hz:
80 waveforms
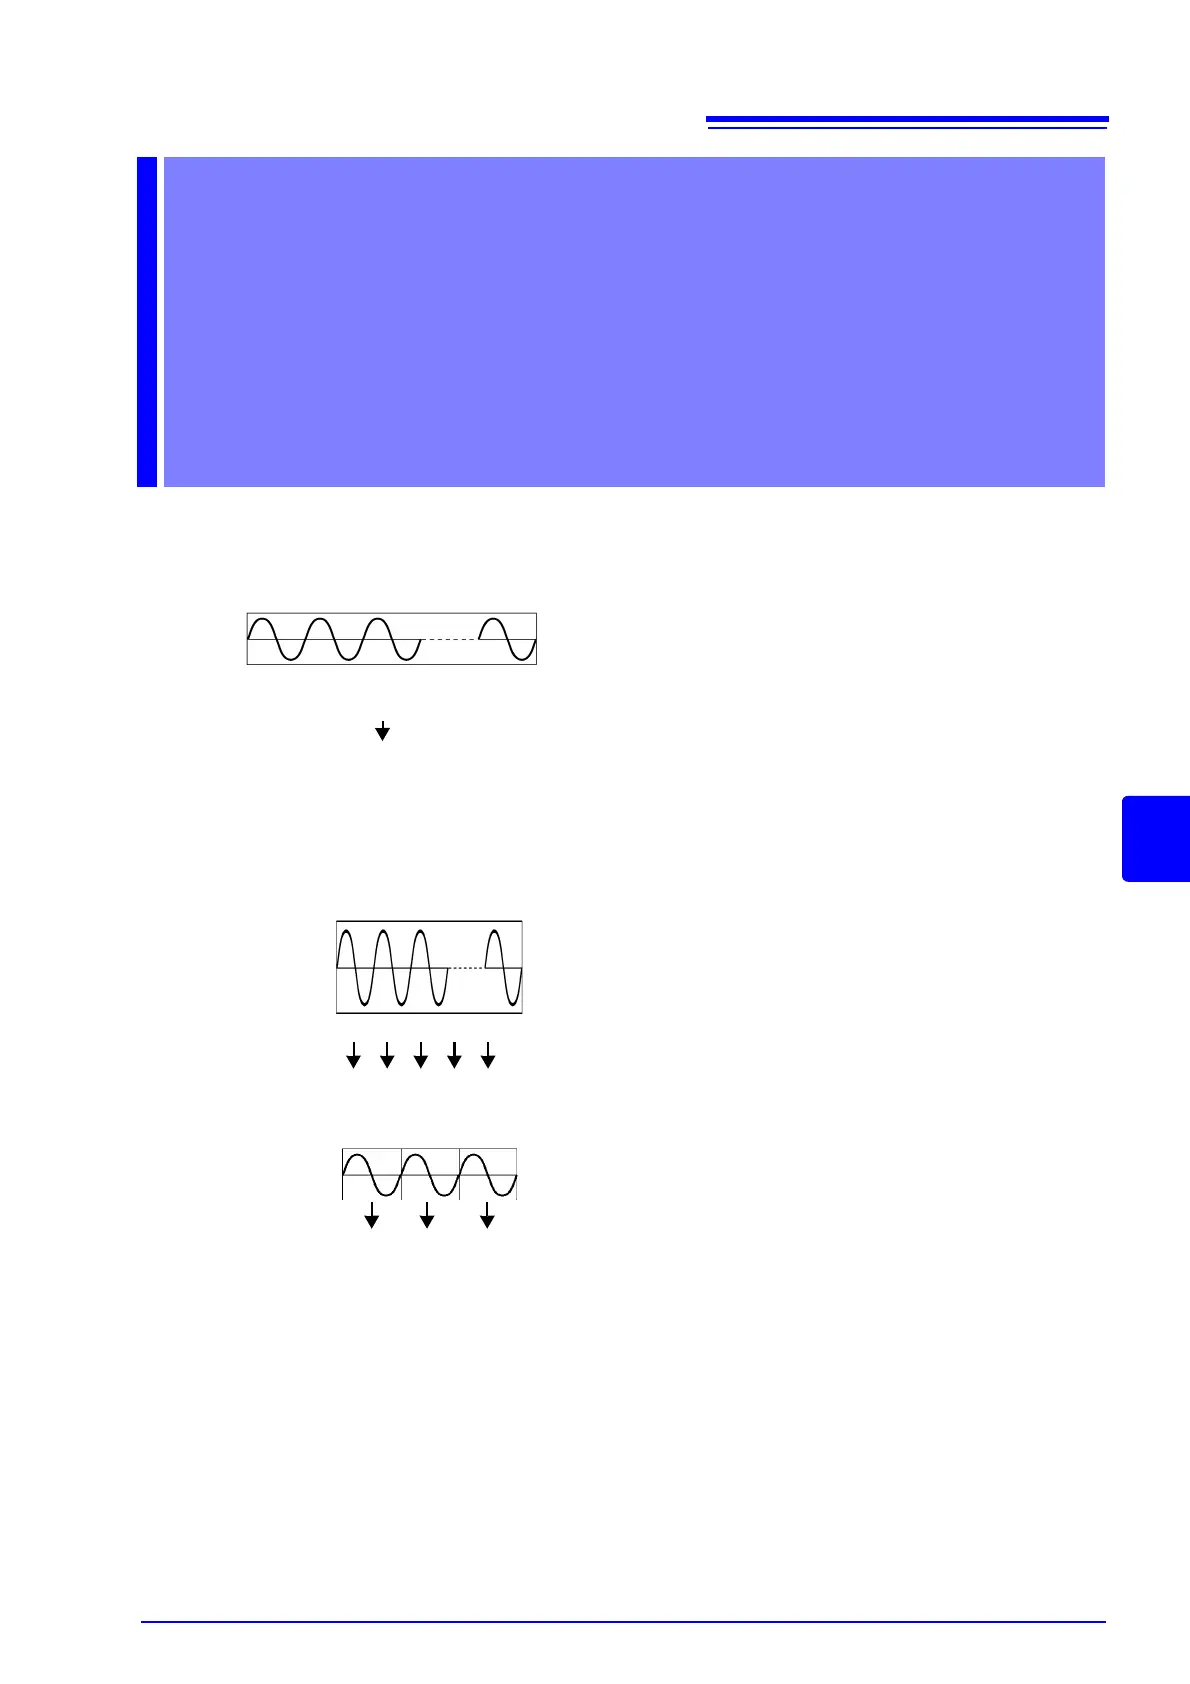
RMS value calculation
Harmonic calculation
RMS voltage calculation
Trend and harmonic trend time series graphs:
Detailed trend time series graph:
The RMS voltage refreshed each half-cycle, frequency
cycle, and other measured values calculated for each
waveform are displayed as a time series graph. The
maximum and minimum values during the TIMEPLOT
interval are recorded. As shown in the figure, RMS volt-
age refreshed each half-cycle is shifted a half-wave
and calculated every wave.
Example
If the TIMEPLOT interval is set to 1 s, there are 100
RMS values and 50 frequency values calculated every
1 s (for a 50 Hz signal). Of those, the maximum and
minimum values are recorded.
See: Trend graph recording methods: "Recording TIMEPLOT
Data and Event Waveforms" (pA.14)
1 2 3 4 5
24
During 50/60 Hz
measurement
During 400 Hz
measurement
123
RMS voltage calculation

 Loading...