8.6 Checking Fluctuation Data
132
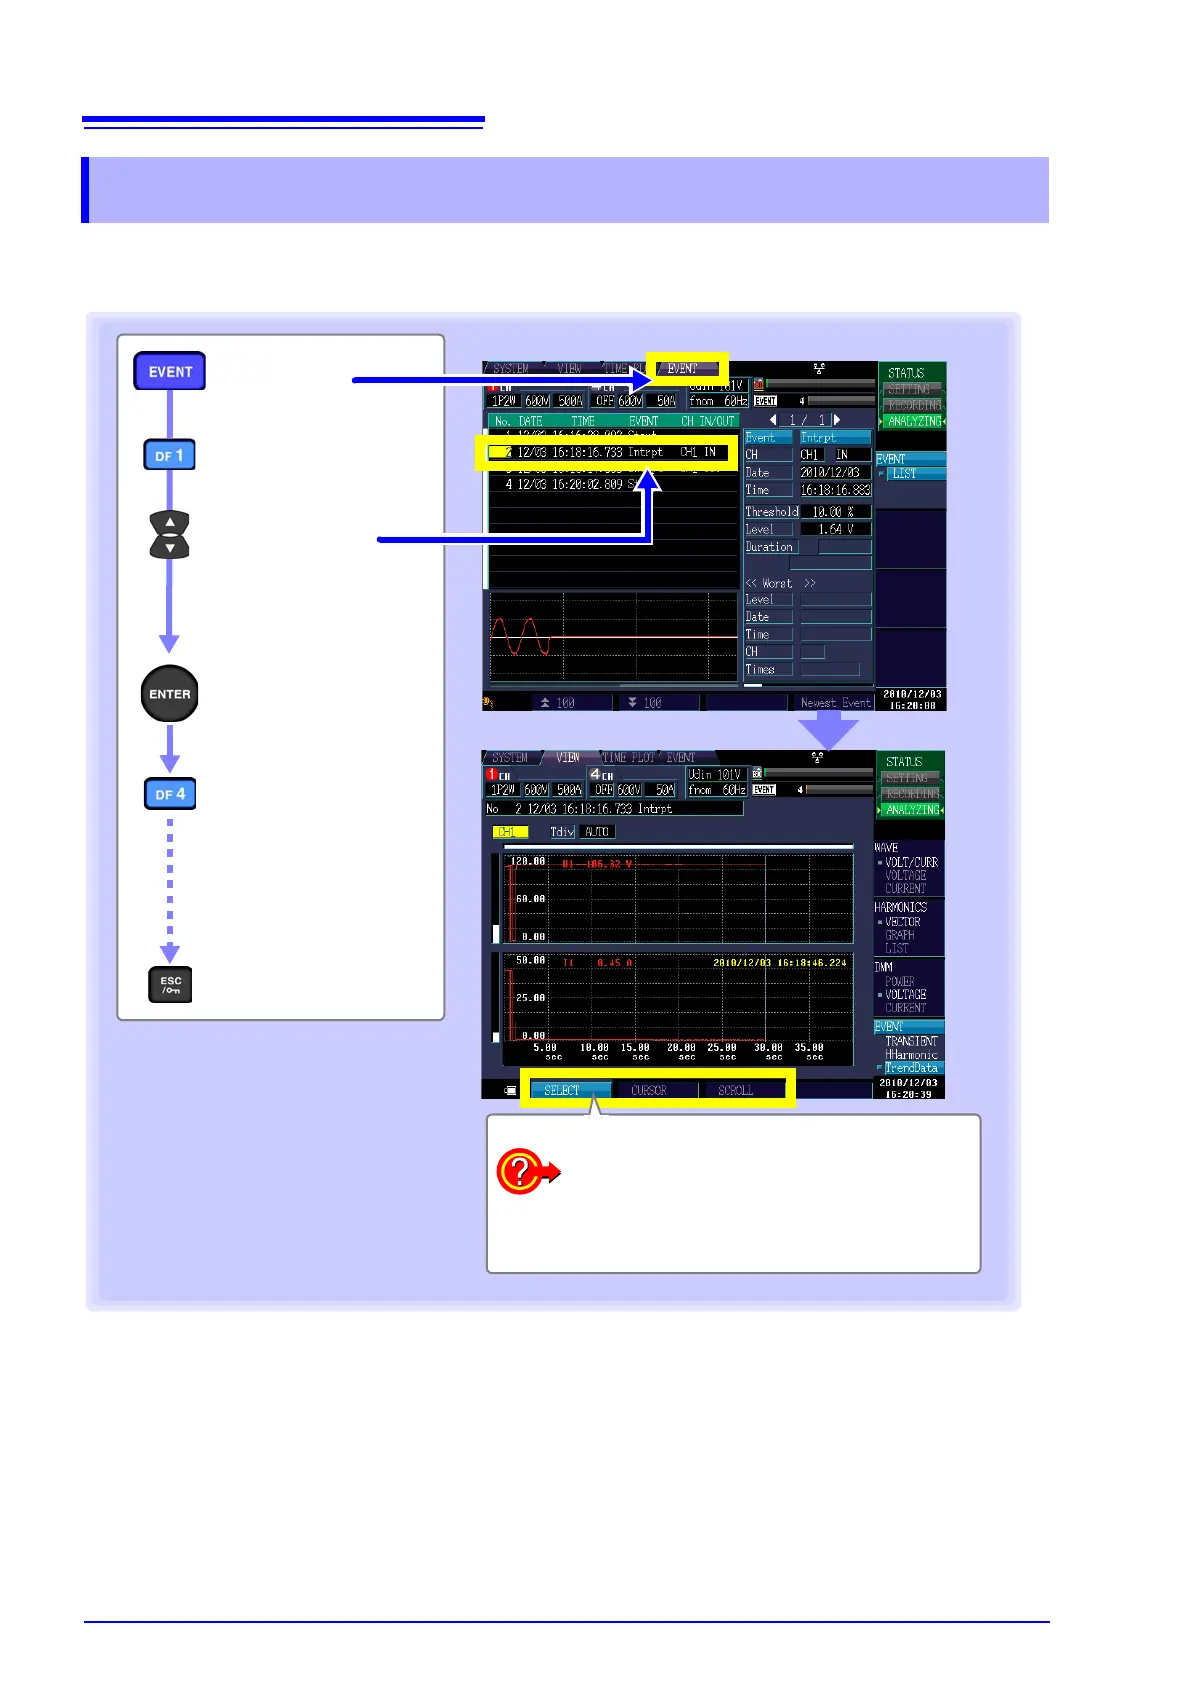
Fluctuation data for swell, dip, interruption, and inrush current events when an event occurs is
displayed for 30 s (from 0.5 s before to 29.5 s after the event IN) as a time series graph (during 400
Hz measurement, from 0.125 s before to 7.375 s after the event IN).
8.6 Checking Fluctuation Data
Accept setting
The display will switch
to the [VIEW] screen,
and an event will occur.
Select a event
Return to event list
[EVENT]
[LIST]
[TrendData]
Fluctuation data display
The U1, U2, and U3 time series graphs
are displayed. The pre-trigger and total
recording periods are fixed at 0.5 and 30
s, respectively.
Red: CH1
Yellow: CH2
Blue: CH3
Gray: CH4
The maximum and minimum values during
the TIMEPLOT interval are shown as the
MAX and MIN values.
To change the displayed channels (p.133)
To enlarge or reduce the graph (p.133)
To read the value above the cursor (p.134)
To scroll waveform data (p.134)
Select with the F key.
 Loading...