GENERAL ENGINEERING DATA
ENGINEERING MANUAL OF AUTOMATIC CONTROL
479
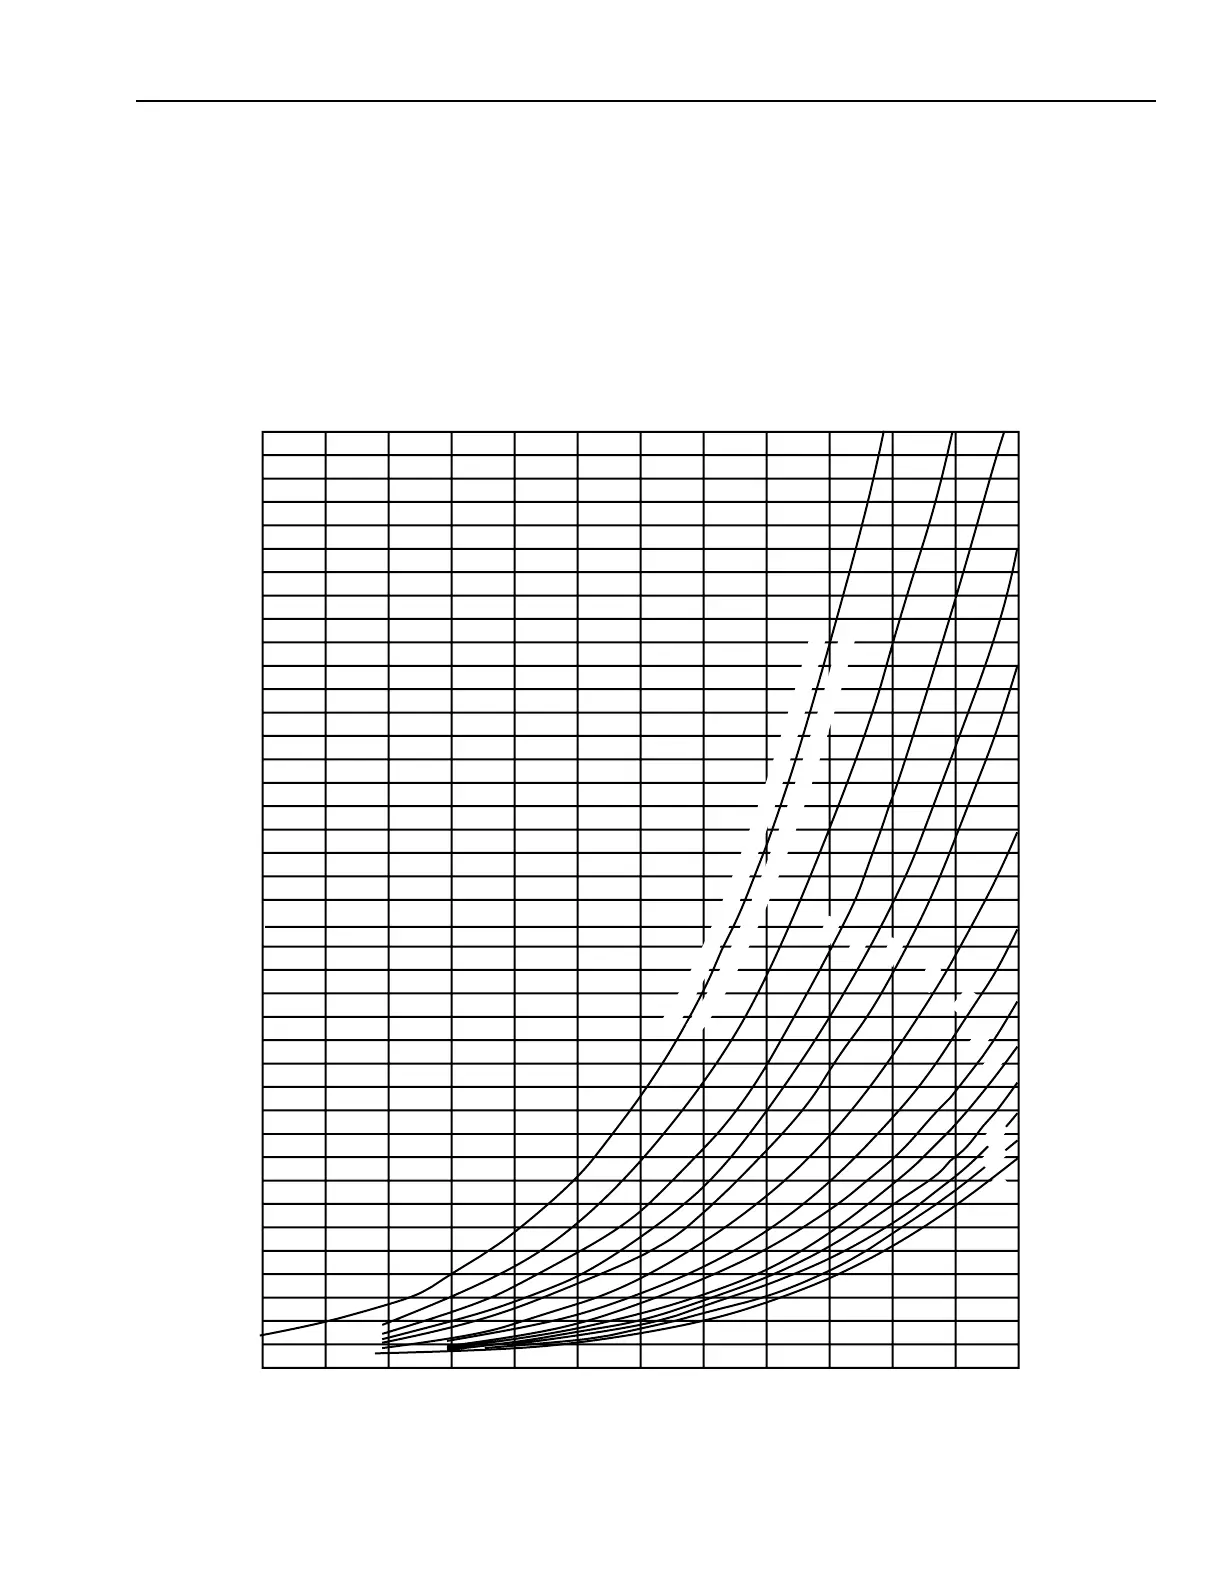
MOISTURE CONTENT OF AIR DATA
Fig. 7. Moisture in Compressed Air Versus Temperature and Pressure.
See Psychrometric Chart Fundamentals section for use of
the psychrometric chart.
MOISTURE IN COMPRESSED AIR
Compressed air cannot hold as much moisture as air at
atmospheric pressure. When compressed, moisture often
condenses out leaving the air saturated with moisture.
Pneumatic systems require dry air to prevent problems with
actuators or filters or restrictions in controllers. Figure 7 is used
to determine the maximum water vapor content of compressed
air at various temperatures and pressures.
EXAMPLE:
Assume ambient conditions are 25°C and 80 percent rh.
The air is compressed and stored in a tank at 310 kPa and
30°C.
Air is delivered to the controls at 240 kPa.
4
6
8
10
14
16
18
20
22
24
26
28
30
32
34
36
38
12
2
40
–15 –10 -5 0 5 10 15 20 25 30 35 40 45
COMPRESSED AIR TEMPERATURE, ˚C
GRAMS OF MOISTURE PER KILOGRAM OF DRY AIR
C4348
135
M
A
X
I
M
U
M
W
A
TER
VA
P
O
R
C
O
NTENT A
T
1
0
1
.
3
2
5
k
P
a
,
A
T
M
O
S
H
E
R
I
C
P
R
E
S
S
U
R
E
(
E
A
C
H
P
R
E
S
S
UR
ELI
N
E
I
S
F
O
RSATU
R
A
T
E
D
M
I
X
T
U
R
E
O
F
W
A
T
E
R
V
A
P
O
R
A
N
D
A
I
R
)
170
205
515
240
310
375
450
585
725
790
655
 Loading...