PSYCHROMETRIC CHART FUNDAMENTALS
ENGINEERING MANUAL OF AUTOMATIC CONTROL
39
Specific volume: The volume of air per unit of mass. Specific
volume can be expressed in cubic meters per kilogram
of dry air. The reciprocal of density.
Total heat (also termed enthalpy): The sum of sensible and
latent heat expressed in Kilojoule per unit of mass of
the air. Total heat, or enthalpy, is usually measured
from zero degrees Celsius for air. These values are
shown on the ASHRAE Psychrometric Charts in
Figures 33 and 34.
Wet-bulb temperature: The temperature read on a thermom-
eter with the sensing element encased in a wet wick
(stocking or sock) and with an air flow of 4.57 meters
per second across the wick. Water evaporation causes
the temperature reading to be lower than the ambient
dry-bulb temperature by an amount proportional to
the moisture content of the air. The temperature re-
duction is sometimes called the evaporative effect.
When the reading stops falling, the value read is the
wet-bulb temperature.
The wet-bulb and dry-bulb temperatures are the easiest
air properties to measure. When they are known, they
can be used to determine other air properties on a
psychrometric chart.
DESCRIPTION OF THE PSYCHROMETRIC CHART
The ASHRAE Psychrometric Chart is a graphical represen-
tation of the thermodynamic properties of air. There are five
different psychrometric charts available and in use today:
Chart No. 1 — Normal temperatures, 0 to 50°C
Chart No. 2 — Low temperatures, –40 to 10°C
Chart No. 3 — High temperatures, 10 to 120°C
Chart No. 4 — Very High temperatures, 100 to 200°C
Chart No. 5 — Normal temperature at 750 meters above
sea level, 0 to 50°C
Chart No. 6 — Normal temperature at 1500 meters
above sea level, 0 to 50°C
Chart No. 7 — Normal temperature at 2250 meters
above sea level, 0 to 50°C
Chart No. 1 can be used alone when no freezing temperatures
are encountered. Chart No. 2 is very useful, especially in
locations with colder temperatures. To apply the lower range
chart to an HVAC system, part of the values are plotted on
Chart No. 2 and the resulting information transferred to Chart
No. 1. This is discussed in the EXAMPLES OF AIR MIXING
PROCESS section. These two charts allow working within the
comfort range of most systems. Copies are provided in the
ASHRAE PSYCHROMETRIC CHARTS section.
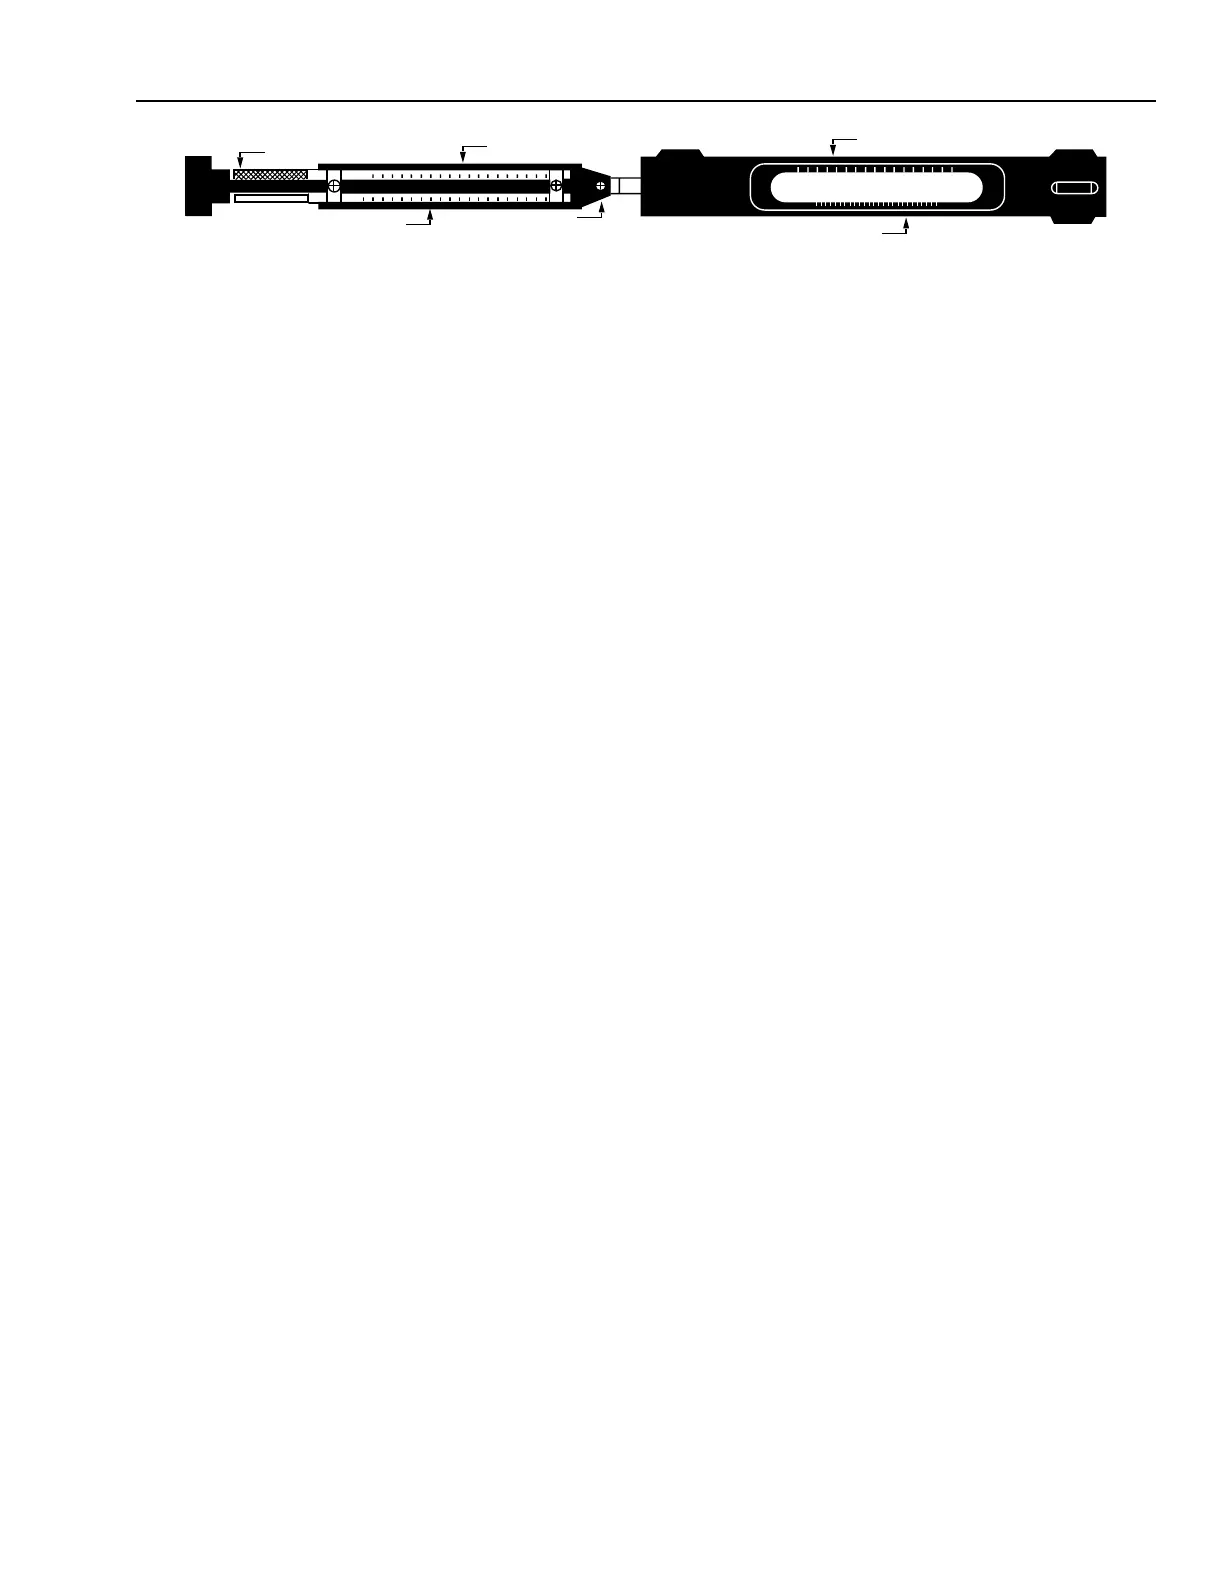
C1828
RELATIVE HUMIDITY SCALE
HANDLE
PIVOT
WET-BULB THERMOMETER
DRY-BULB THERMOMETER
WATER-SOAKED WICK
Fig. 1. Sling Psychrometer.
 Loading...