Model 2701 User’s Manual Buffer 6-7
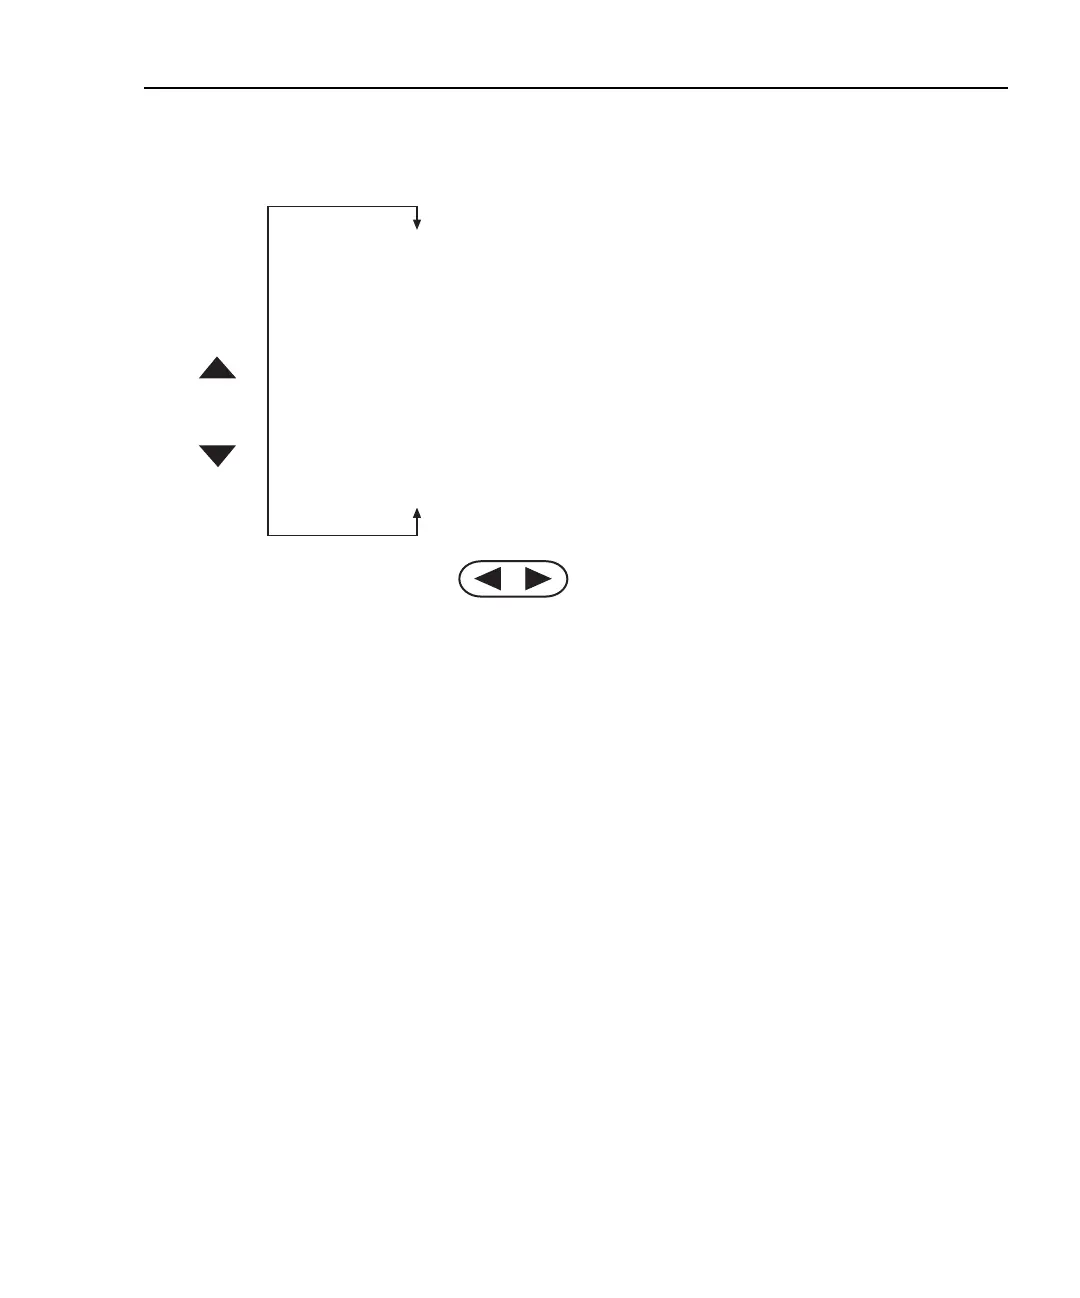
Figure 6-2
Recalling buffer data — real-time clock timestamp
Buffer statistics
Minimum and maximum
This mode displays the minimum and maximum readings stored in the buffer. The buffer
location number and timestamp are also provided for these readings.
Peak-to-peak
This mode displays the peak-to-peak reading (peak-to-peak = Maximum - Minimum).
Average
The average mode displays the mean (average) of all measured readings stored in the
buffer. The following equation is used to calculate mean:
where: y is the average.
X
i
is a stored reading.
n is the number of stored readings.
RDG NO. 10 Reading Value Time Date
RDG NO. 9 Reading Value Time Date
RDG NO. 8 Reading Value Time Date
RDG NO. 7 Reading Value Time Date
RDG NO. 6 Reading Value Time Date
RDG NO. 5 Reading Value Time Date
RDG NO. 4 Reading Value Time Date
RDG NO. 3 Reading Value Time Date
RDG NO. 2 Reading Value Time Date
RDG NO. 1 Reading Value Time Date
STD DEV Standard Deviation Value No Time No Date
Average Average Value No Time No Date
Peak-to-Peak Peak-to-Peak Value No Time No Date
Min At XX Minimum Value Time Date
Max At XX Maximum Value Time Date
RANGE
RANGE
y
X
i
i1=
n
∑
n
---------------
=
 Loading...