Specifications A-9
measures the input signal. The “reference” and “reference zero” phases are associated with a
precision voltage reference inside the SourceMeter. By measuring all three phases, zero drift
for the reading is reduced. A/D conversion time is programmable with 0.01 power line cycle
resolution.
When Auto-Zero is enabled, all three phases are measured each time the SourceMeter is
triggered. With Auto-Zero disabled, only the “signal” is measured. Hence, speed is increased at
the expense of long term drift.
Firmware overhead
This is the time associated with A/D communication, reading calibration, and other opera-
tions necessary to perform the SDM cycle. This time is not illustrated in the following timing
diagrams.
Timing diagrams
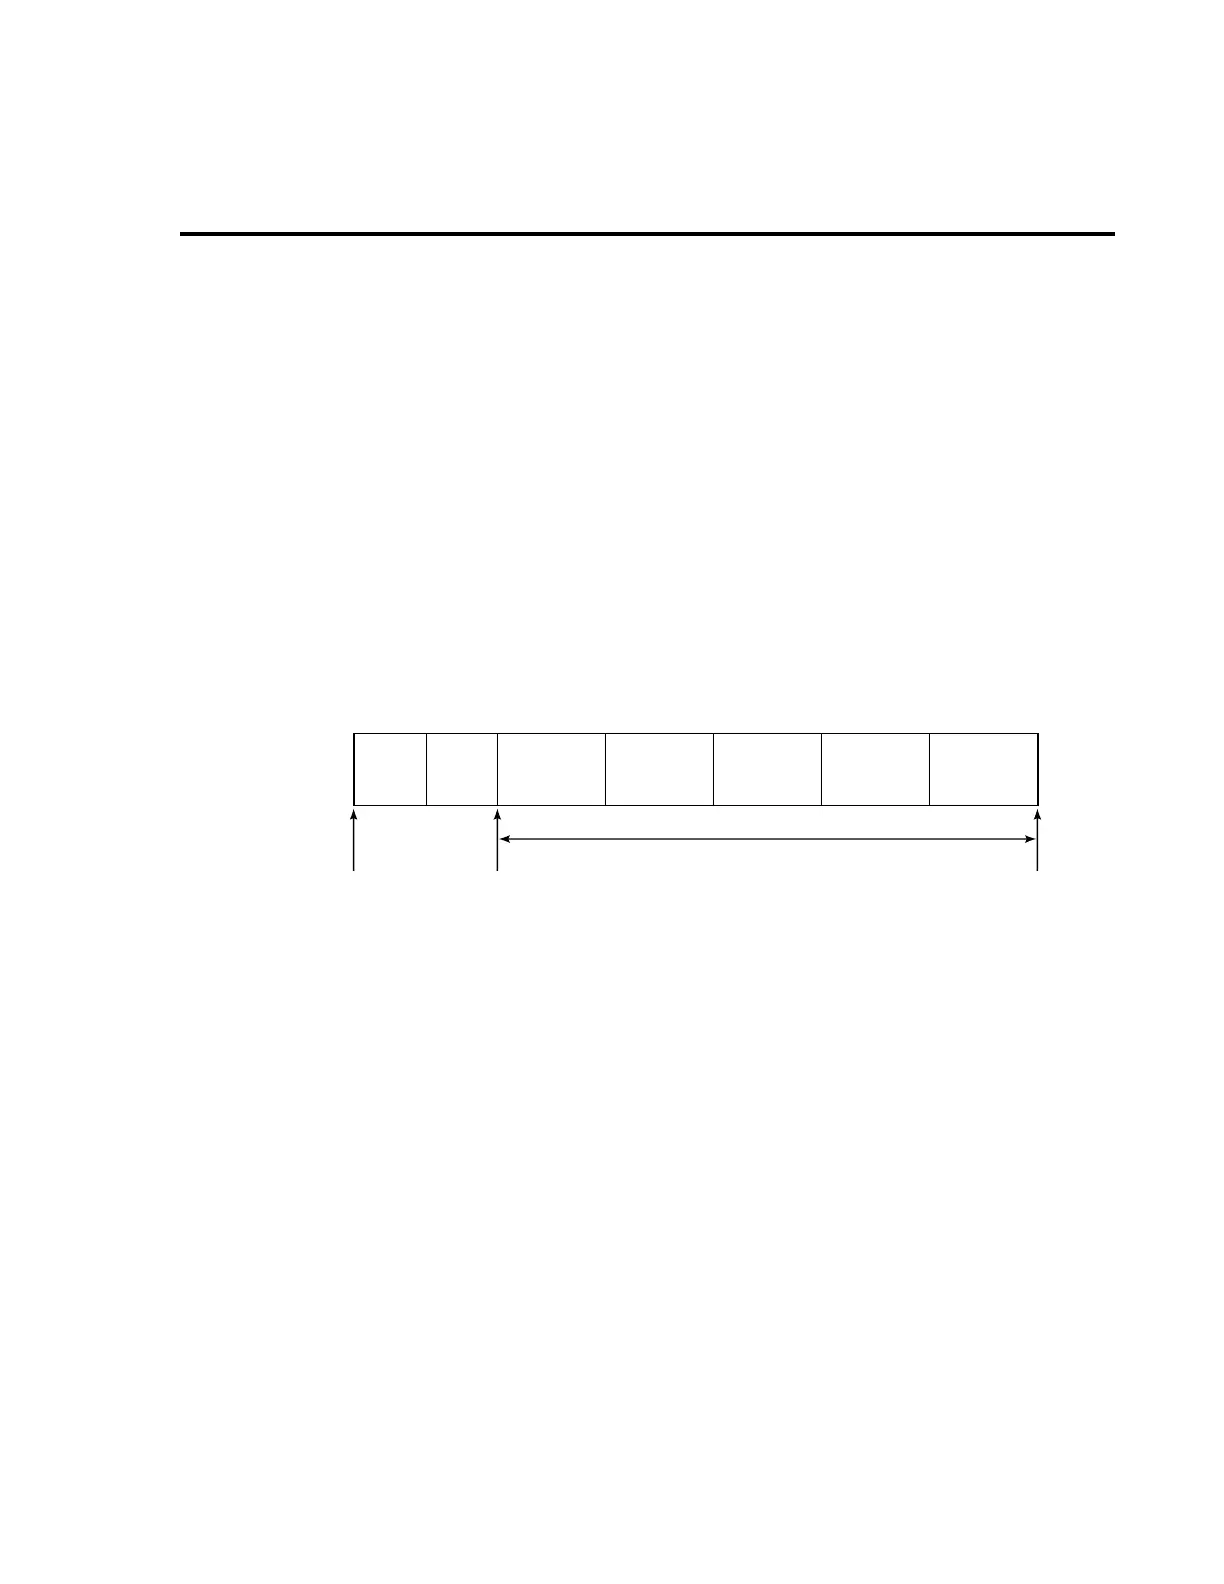
Case I: Auto-Zero enabled and measuring a single function
Trigger Latency: 225µsec max
Source Configuration: 50µsec max
A/D Conversion: [NPLC Setting
×
(1/power line frequency)] + 185
Firmware Overhead: 1.8msec for Source V
2.15msec for Source I
Source On Time
≅
Source Configuration + Source Delay + (3
×
A/D Conversion) + Firm-
ware Overhead
Example: Source Delay = 0µsec
NPLC Setting = 0.01 PLC
Power Line Frequency = 60Hz
Source On Time
≅
50µsec + 0 + [(3
×
0.01
×
1/60) + 185µsec] + 1.6msec
≅
2.9msec for Source V
≅
3.25msec for Source I
Trigger
Latency
Trigger
Delay
Trigger
Event
Source
On
Source On Time
Source
Off
Source
Configuration
Source
Delay
A/D
Conversion
(current signal
phase)
A/D
Conversion
(ref phase)
A/D
Conversion
(ref zero phase)
i
g
u
r
e A-1
Case I timing
diagram
 Loading...